The What’s a Good Subject Test Score post deals with the relationship between old SAT scores and Subject Test scores. Most students now take the new PSAT, new SAT, or the ACT. In order to work backward to old SAT scores, a concordance table must be used. The concordance table below allows students to take their ACT or new SAT scores (new PSAT and new SAT scores are interchangeable) and find the comparable old SAT score. In most cases, this translation makes only a small difference (10–40 points). The principle that the pool of test takers is a good predictor of Subject Test scores still holds true.
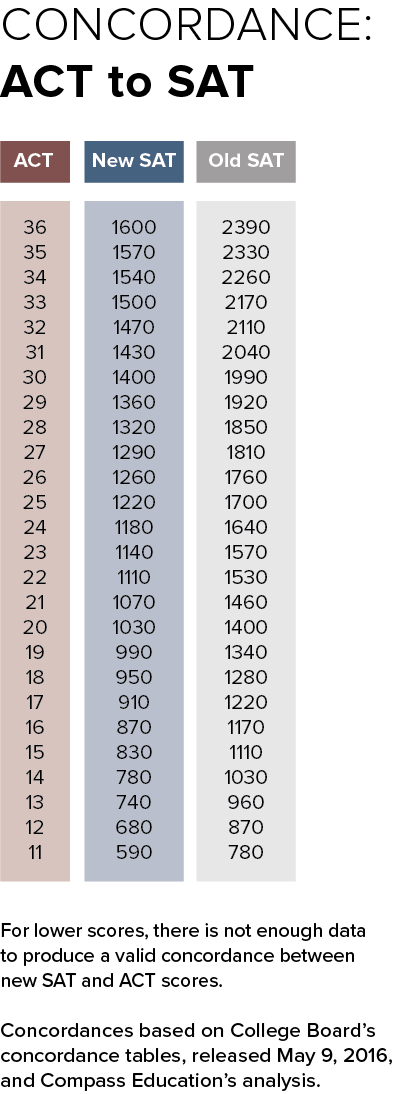
The ACT concordance table shows that an ACT Composite of 30 is comparable to an average old SAT section score of about 660 (total score of 1990). Based on the relationship observed between Subject Test scores and old SAT scores, we can expect that students scoring an ACT Composite of 30 will have a mean U.S. History score of approximately 650–680. This does not predict the score for an individual student, but it does provide a way of comparing Subject Test scores or assessing where a student stands versus comparable ACT scorers.
The concordance table shows that a total new SAT score of 1360 is comparable to an average old SAT section score of 640 (total score of 1920). Based on the relationship observed, we can expect that students with a 1360 new SAT score will have a mean U.S. History score of approximately 630–650. This does not predict the score for an individual student, but it does provide a way of comparing Subject Test scores or assessing where a student stands versus comparable new SAT scorers.
Evidence of the relationship between SAT scores and Subject Test scores
The table below shows the mean old SAT scores (the only scores College Board has released to date) earned by the students taking a particular Subject Test. The data shows that there is a roughly linear relationship between average old SAT score and mean Subject Test score. An obvious outlier is World History, where Subject Test results lag SAT scores.
Subject Test and SAT Means (2015)
| Subject Test | Subject Test Mean | SAT CR | SAT M | Average CR and M |
|---|---|---|---|---|
| Literature | 618 | 639 | 623 | 631 |
| U.S. History | 645 | 642 | 647 | 645 |
| World History | 618 | 650 | 655 | 653 |
| Math Level 1 | 619 | 577 | 628 | 603 |
| Math Level 2 | 690 | 629 | 693 | 661 |
| Biology-E | 625 | 612 | 642 | 627 |
| Biology-M | 652 | 621 | 661 | 641 |
| Chemistry | 666 | 630 | 695 | 663 |
| Physics | 667 | 609 | 701 | 655 |
In order to show that the linear relationship holds for pools of students with varying scores, the changes in scores between 2010 and 2015 were calculated and plotted. Over that period, the pool of test takers shrank, and the mean SAT scores and mean Subject Test scores increased in an expected pattern. Once more, World History is an outlier.
Subject Test and SAT Mean Changes (2010-2015)
| Subject Test | Subject Test Mean Chg | SAT CR Chg | SAT M Chg | Average CR and M Chg |
|---|---|---|---|---|
| Literature | 38 | 41 | 36 | 39 |
| U.S. History | 44 | 37 | 38 | 38 |
| World History | 13 | 28 | 32 | 30 |
| Math Level 1 | 14 | -5 | 10 | 10 |
| Math Level 2 | 41 | 29 | 35 | 35 |
| Biology-E | 24 | 14 | 25 | 20 |
| Biology-M | 14 | 3 | 12 | 8 |
| Chemistry | 22 | 15 | 19 | 17 |
| Physics | 9 | -2 | 5 | 2 |
Old SAT scores—or new SAT or ACT scores that have been concorded—provide a rule of thumb for estimating Subject Test scores for a group of students. This comparison is important because the population of students taking the tests varies widely.