
When admission letters came in last spring, there was more head-scratching than usual among counselors and families. Much of the discussion revolved around how unpredictable things seemed, especially when it came to test scores.
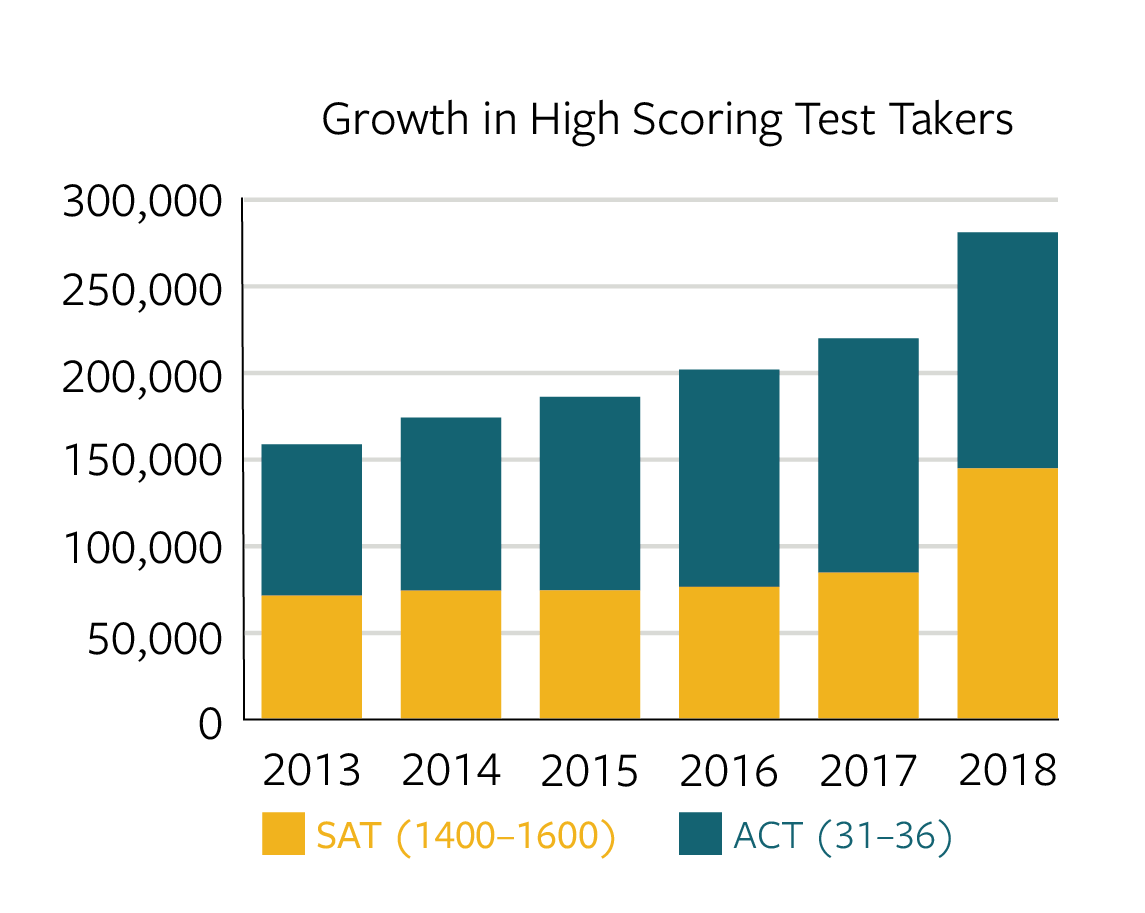
With the release of class of 2018 results from both ACT and College Board, we can now say definitively that students saw the most competitive scores ever. In the last 10 years, the number of students scoring 1400–1600 on the SAT or 31–36 on the ACT doubled.
In just the last 5 years, the number of students scoring 1500–1600 or 34–36 has doubled. Compass has examined, in-depth, how this trend has been shaped, why it accelerated in 2018, and what impact it has on admissions.
A big shift in the SAT
The SAT regained momentum last year, and once more became the most popular—if that’s the right word—admission test. The story that has been overlooked is the surge in top scores. In the class of 2017, College Board reported 85,000 students scored between 1400 and 1600. For the class of 2018, 145,000 fell in this range—a 71% jump in a single year!
While the size of last year’s change was unusual, its direction was not. The increase fits a historical trend for both the SAT and ACT that shows no signs of abating. Students, parents, counselors, and even admission offices, may need to reconsider their confidence about what a “great” score is. A high score is no less of an achievement from an academic standpoint, but it is an achievement shared by a wider set of students. It has become more difficult to distinguish oneself with high scores.
A note about “high scorers” or “top scores.
A real world example
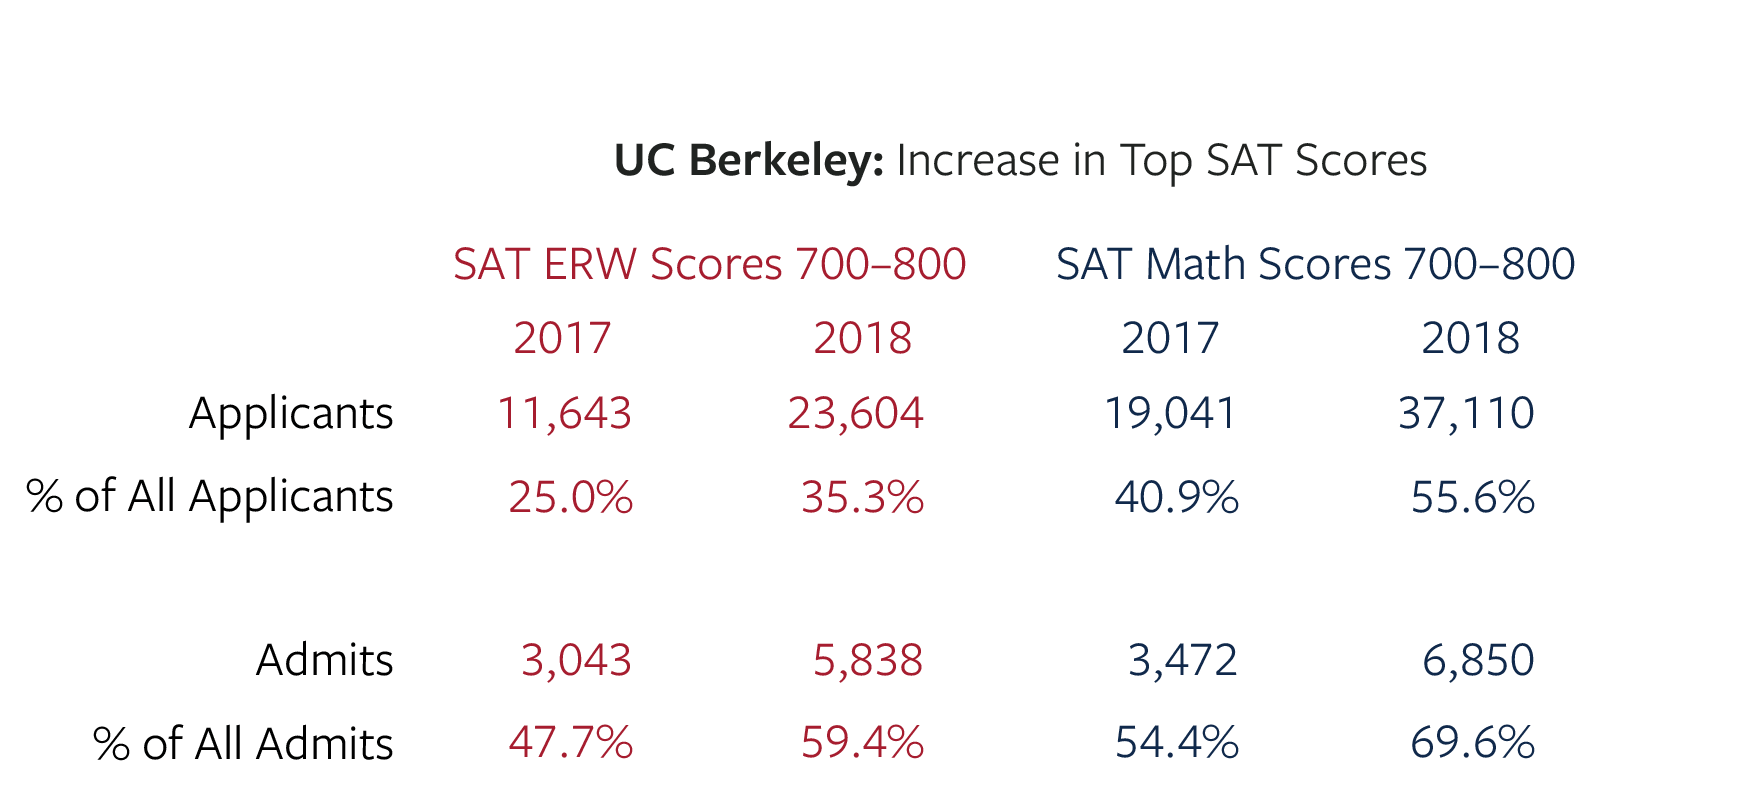
UC Berkeley is one of the most competitive schools in the country and provides context because it—along with the other University of California campuses—publishes applicant and admission data by score range. The state and national trends we are seeing are reflected in Berkeley’s statistics. The number of applicants with SAT ERW and SAT Math scores at 700–800 approximately doubled last year. While it is true that some of that change is a reflection of overall SAT and applicant growth, the percentage of applicants in the top score range also increased. As shown below, the percentage of students with Math scores at or above 700 went from 41% of applicants in 2017 to 56% of applicants in 2018. Nor was the change limited to applicants. Admitted students fell in the top range 54% of the time in the fall 2017 cycle, but 70% of the time in the 2018 cycle.
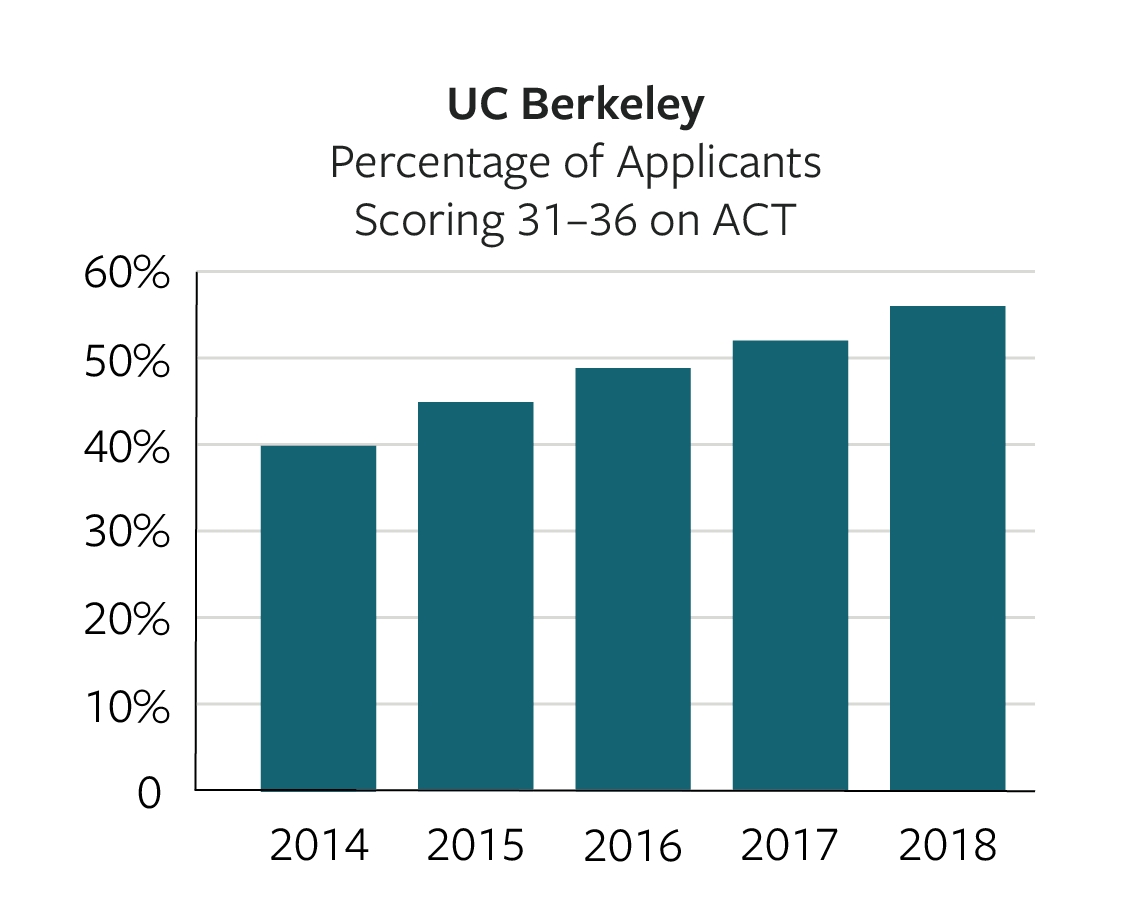
 ACT scores at Berkeley have also seen a steady uptick. Below is a graph over the last five years of the percentage of ACT applicants who have scores in the highest band of composite scores, 31–36.
 The whole hides the parts
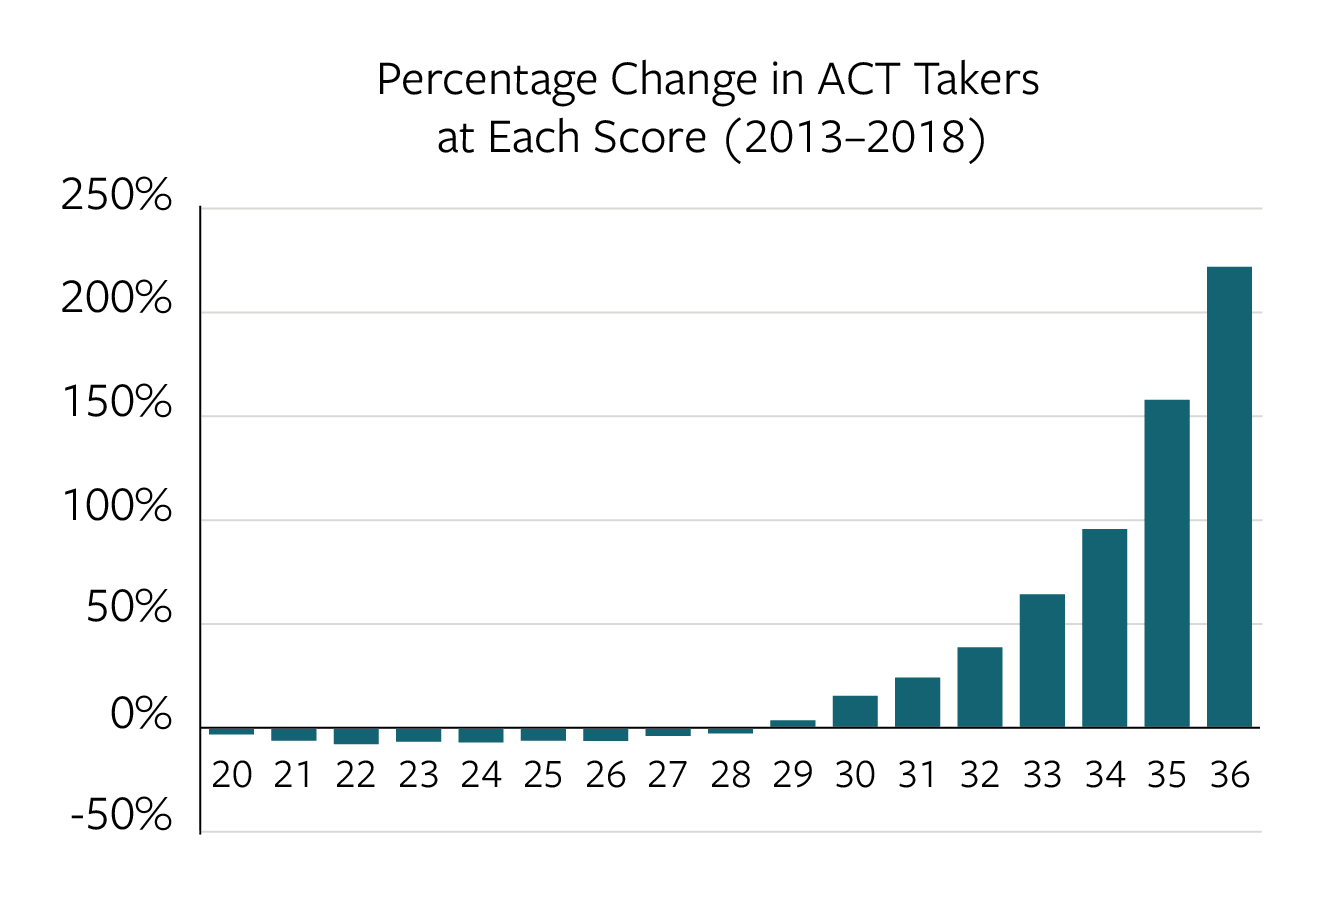
News stories about SAT and ACT data tend to focus on the overall figures—total test takers or average scores. This approach masks shifts in test results and test taker behavior—particularly at the “tails” of the score distributions. For example, if the number of low-scoring and high-scoring students increase by equal numbers, the mean score may not move at all. Between 2008 and 2018, the average ACT composite score went from 21.1 to 20.8, an insignificant change. Yet nine times as many students achieved a 36 in 2018.
Two very different trends help explain this divergence. In recent years, College Board and ACT have focused on selling statewide testing. By having every student participate, states have brought college awareness and preparedness to wide swaths of students. As a group, students who test only because they are required to test score lower than students who opt-in.
High scoring test takers are more likely to be free agents, deciding on the best test based on individual preferences. These students have become savvy consumers, and don’t feel the need to follow labels such as “ACT state” versus “SAT state.” They are increasingly likely to consider both tests and, in many cases, take both tests. Informed test choice often allows them to start at a higher point versus a coin flip decision and may allow them to make progress more quickly.
Where were the high scorers?
State-mandated testing explains why Illinois and Colorado come out on top in SAT taker growth. An additional 186,000 students took the SAT in those states in the class of 2018, because both states switched from funding the ACT for all students to funding the SAT for all students. The two states had a more muted impact on high scorers, accounting for just one-tenth of the increase in top scores. Free agent states such as California, New York, New Jersey, and Massachusetts made up much of the rest. International students also played a large role in the shake-up of scores at the high end. An additional 9,077 international students scored in the 1400–1600 range in the class of 2018, despite the fact that there were only an additional 28,568 SAT test takers. The students who chose to take the SAT expected to do well, and they did. Below is the data for all 50 states, District of Columbia, Puerto Rico, U.S. Virgin Islands, and international.
State | 1400-1600 Scores (2017) | 1400-1600 Scores (2018) | 1400-1600 Scores (Chg) | 1400-1600 (% Chg) | Testers (2017) | Testers (2018) | Testers (Chg) | Testers (% Chg) |
|---|---|---|---|---|---|---|---|---|
| California | 9,331 | 20,799 | 11,468 | 123% | 226,699 | 262,228 | 35,529 | 16% |
| International | 13,189 | 22,266 | 9,077 | 69% | 112,901 | 141,469 | 28,568 | 25% |
| New York | 4,982 | 10,598 | 5,616 | 113% | 135,141 | 162,551 | 27,410 | 20% |
| Illinois | 1,888 | 6,559 | 4,671 | 247% | 12,402 | 145,919 | 133,517 | 1077% |
| New Jersey | 2,843 | 7,463 | 4,620 | 163% | 72,173 | 84,672 | 12,499 | 17% |
| Texas | 6,746 | 10,377 | 3,631 | 54% | 204,409 | 226,374 | 21,965 | 11% |
| Pennsylvania | 3,484 | 5,623 | 2,139 | 61% | 89,218 | 96,740 | 7,522 | 08% |
| Massachusetts | 3,953 | 6,075 | 2,122 | 54% | 56,024 | 59,382 | 3,358 | 06% |
| Florida | 4,071 | 5,847 | 1,776 | 44% | 147,058 | 176,746 | 29,688 | 20% |
| Virginia | 3,450 | 5,179 | 1,729 | 50% | 57,453 | 61,576 | 4,123 | 07% |
| Maryland | 2,247 | 3,843 | 1,596 | 71% | 42,889 | 48,040 | 5,151 | 12% |
| Colorado | 961 | 2,467 | 1,506 | 157% | 5,896 | 58,790 | 52,894 | 897% |
| Georgia | 2,132 | 3,548 | 1,416 | 66% | 63,805 | 74,240 | 10,435 | 16% |
| North Carolina | 2,055 | 3,391 | 1,336 | 65% | 49,595 | 54,987 | 5,392 | 11% |
| Washington | 2,048 | 3,191 | 1,143 | 56% | 43,911 | 48,574 | 4,663 | 11% |
| Michigan | 3,273 | 4,276 | 1,003 | 31% | 110,082 | 115,281 | 5,199 | 05% |
| Connecticut | 2,140 | 3,097 | 957 | 45% | 43,252 | 44,700 | 1,448 | 03% |
| Ohio | 1,856 | 2,461 | 605 | 33% | 14,545 | 22,992 | 8,447 | 58% |
| Indiana | 1,546 | 2,066 | 520 | 34% | 45,622 | 48,962 | 3,340 | 07% |
| Arizona | 1,313 | 1,789 | 476 | 36% | 20,466 | 20,188 | -278 | -01% |
| Oregon | 882 | 1,229 | 347 | 39% | 15,866 | 17,476 | 1,610 | 10% |
| South Carolina | 751 | 1,081 | 330 | 44% | 22,292 | 25,390 | 3,098 | 14% |
| New Hampshire | 692 | 899 | 207 | 30% | 14,758 | 14,834 | 76 | 01% |
| Hawaii | 336 | 483 | 147 | 44% | 7,352 | 7,880 | 528 | 07% |
| Minnesota | 700 | 833 | 133 | 19% | 2,061 | 2,464 | 403 | 20% |
| Tennessee | 767 | 897 | 130 | 17% | 3,495 | 4,181 | 686 | 20% |
| Delaware | 309 | 426 | 117 | 38% | 10,060 | 11,055 | 995 | 10% |
| District of Columbia | 283 | 400 | 117 | 41% | 4,801 | 4,985 | 184 | 04% |
| Rhode Island | 315 | 426 | 111 | 35% | 7,205 | 10,161 | 2,956 | 41% |
| Louisiana | 338 | 434 | 96 | 28% | 1,696 | 2,027 | 331 | 20% |
| Maine | 408 | 501 | 93 | 23% | 13,826 | 14,310 | 484 | 04% |
| Missouri | 602 | 695 | 93 | 15% | 1,990 | 2,420 | 430 | 22% |
| New Mexico | 209 | 295 | 86 | 41% | 2,342 | 3,225 | 883 | 38% |
| Alabama | 363 | 441 | 78 | 21% | 2,393 | 2,878 | 485 | 20% |
| Nevada | 375 | 452 | 77 | 21% | 6,245 | 5,588 | -657 | -11% |
| Alaska | 113 | 182 | 69 | 61% | 2,971 | 3,334 | 363 | 12% |
| Kentucky | 412 | 475 | 63 | 15% | 1,608 | 1,925 | 317 | 20% |
| Kansas | 351 | 414 | 63 | 18% | 1,199 | 1,419 | 220 | 18% |
| Vermont | 227 | 289 | 62 | 27% | 4,303 | 4,323 | 20 | 00% |
| Wisconsin | 602 | 661 | 59 | 10% | 1,780 | 1,923 | 143 | 08% |
| Idaho | 415 | 465 | 50 | 12% | 18,757 | 20,484 | 1,727 | 09% |
| West Virginia | 117 | 159 | 42 | 36% | 2,406 | 5,058 | 2,652 | 110% |
| Puerto Rico | 43 | 82 | 39 | 91% | 2,913 | 3,783 | 870 | 30% |
| Arkansas | 200 | 238 | 38 | 19% | 1,065 | 1,591 | 526 | 49% |
| Utah | 278 | 314 | 36 | 13% | 1,277 | 1,425 | 148 | 12% |
| South Dakota | 45 | 74 | 29 | 64% | 237 | 260 | 23 | 10% |
| Montana | 110 | 134 | 24 | 22% | 990 | 952 | -38 | -04% |
| Iowa | 277 | 300 | 23 | 08% | 861 | 994 | 133 | 15% |
| Wyoming | 24 | 45 | 21 | 88% | 144 | 169 | 25 | 17% |
| Oklahoma | 328 | 346 | 18 | 05% | 2,776 | 3,337 | 561 | 20% |
| Mississippi | 180 | 196 | 16 | 09% | 716 | 806 | 90 | 13% |
| North Dakota | 38 | 48 | 10 | 26% | 123 | 148 | 25 | 20% |
| Virgin Islands | 9 | 7 | -2 | -22% | 752 | 635 | -117 | -16% |
| Nebraska | 199 | 187 | -12 | -06% | 680 | 688 | 8 | 01% |
The Curious Case of California
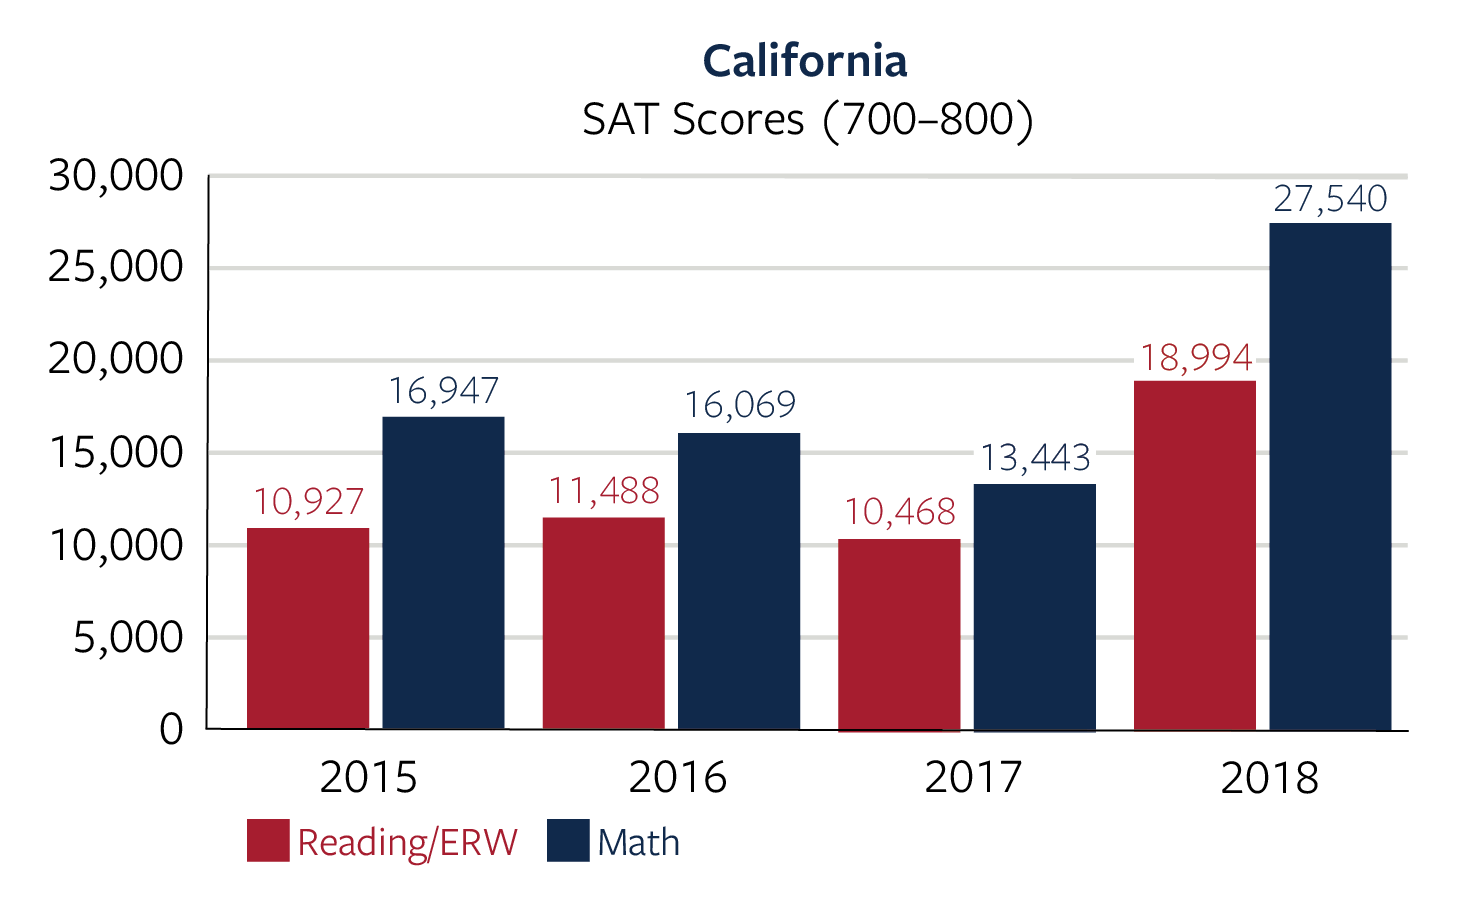
Last year California became, for the first time ever, the largest market for both the SAT and ACT. The state’s sheer size is not the only reason it provides a useful case study. California has never had state-mandated or state-funded college admission testing, and its test taker population is highly diverse. The case of California shows how test taker behavior played a role in the rise of high scores.
In California’s class of 2017, there was actually a decline in the number of students in the top tier of scores. These students defected to the ACT. With the class of 2018, those students returned. And they brought their friends! The number of students scoring above 1400 on the SAT more than doubled in a single year.
This flow out and back in is why Compass does not believe that the increase in top scores can be attributed solely to score inflation, an “easier” test, or more effective preparation.
Many top scorers in the class of 2017 chose to avoid the uncertainty of the new SAT when they drew up their testing plans. For some, this meant squeezing in an old SAT before it disappeared. For others, it meant switching to a known commodity, the ACT. And for still others, it meant trying multiple test types.
Don’t percentiles give an accurate accounting?
Percentiles can be a useful way of describing test score distribution. They are, though, a lagging indicator. The figures shown on the class of 2018’s SAT score reports were based on the performance of students in the class of 2017. Percentiles were misleadingly optimistic—a high scoring student’s actual rank within the class of 2018 would have been lower than projected. Even upcoming SAT reports will show percentiles that understate the number of high scores. College Board will be reporting percentiles based on both the classes of 2017 and 2018 (it is phasing in the use of a 3-year running average). While basing percentiles off of two or three class years can smooth out minor ups and downs, the policy makes less sense when the trajectory is always in one direction. We won’t have full data on the class of 2019’s performance for another 11 months, but it will certainly be higher than what the percentiles indicate. Percentiles also do not reflect the impact of highest score or superscoring policies.
Compass frequently encounters the misperception that standardized scores are always normally distributed about a mean. In fact, the scale is only meant to ensure that a 700 or a 33 means the same thing in one year as it does in the next. The distribution changes every year. It is not designed so that the same number of students earn a certain score each year. That’s why any rule-of-thumb take on a good or great score can be outdated as soon as it is given. If scores become too clumped at the high end, a concern is that they will be less useful in distinguishing students or in predicting performance in college.
From a student’s viewpoint, any mistake becomes more costly as score groups become more populated. [For optimistic students, any gain becomes more valuable!] Imagine a student in the class of 2017 who expected to score a 750 Math, but instead scored a 700. The shortfall would have put an additional 70,000 students ahead of her. Transplant that student to the class of 2018, and she would have seen closer to 120,000 students pass her—that is even before considering highest score or superscore policies. As the controversy over the June SAT demonstrated, even 2 or 3 missed problems can easily drop a student 50 points. It is understandable why students sometimes feel that they are on a knife’s edge.
An easier experience
Compass does not believe that the defection/re-adoption theory explains the entirety of the change in high scores on the SAT. The class of 2018 faced fewer obstacles than had the class of 2017. The new SAT is, loosely speaking, the only SAT the class of 2018 ever knew. They took the new PSAT as sophomores, repeated it as juniors, and all of their SAT scores are on the new exam. There was less noise around SAT versus ACT and more signal. Students could make optimal decisions without feeling like guinea pigs in a College Board experiment. They could test early or late without worrying about the change from old SAT to new. As more information became available for the SAT, they were better prepared than the class of 2017. In short, the class of 2018 didn’t necessarily face an easier test; they faced an easier experience.
An accounting change
The old SAT introduced an odd accounting problem for College Board. Its 2017 report included only students who took the new SAT. This excluded students who finished up their testing with the old SAT. Because that group skews toward high-performing students, the 1400–1600 total of 85,000 students likely undercounted top scores in the class of 2017 by 5,000–10,000. This helps explain why the 2017 figure was so low.
The source of the high score surge is not entirely academic. The concordance of SAT and ACT scores was based on the performance of class of 2017 students who took both exams. If the class of 2018 differed significantly from the class of 2017, then the concordance is less accurate—at least at the high end of the scale.
Wouldn’t an increase in SAT numbers be offset by a decrease in ACT numbers?
An additional buyer of a Ford pick-up means one less buyer of a Chevy or Ram. The same cannot be said about the SAT. Many high-scoring students have “discovered” the ACT and added it to their portfolios rather than switching to it exclusively. The increase in top scores on the ACT slowed with the class of 2018, but it did not reverse, despite an overall drop of 176,000 test takers.
The role of dual testing
Taking both the SAT and ACT has played a role in the growth of high scores. It has added to the total number of tests taken by high scorers and allowed them to rack up more top scores. However, a student has only one best score (even a concordant tie means a single score can summarize things). This leads to some double-counting of high scores, something not unique to the class of 2018. For example, a student with a 33 ACT receives no benefit from having scored a 1420 on the SAT, even though the latter score would count in College Board’s figures.
Neither College Board nor ACT report on cross testing. In fact, they don’t even have direct access to this data, as both must adhere to privacy restrictions. Based on data from competitive colleges, we estimate that approximately one-third of high scoring students take both exams at least once.
This trend does not mean that students are at a disadvantage if they only focus on one test. It is difficult to be fully and equally prepared for two admission tests. What is important is that students increasingly consider both tests and try to find the optimal path.
What about the most exceptional scores?
Most of the discussion above has been about students in the 1400–1600 range because College Board has stopped reporting the number of students at each score point. Historical SAT trends and current ACT trends indicate that change at the very highest scores is even more extreme. While the number of ACT scorers at 31 or higher was only up slightly in the class of 2018, for example, the number of perfect scorers spiked by 36%. The top percentile of ACT scores has moved up a full point in the last 5 years. For each of the last 15 years, growth in the most elite scores has outpaced the already significant growth in great scores.
Supersized scores
Despite the gaudy growth numbers this year, the data actually understate the number of top scorers in one way. In their reported figures, College Board and ACT use a student’s most recent test performance. A student scoring a 1450 in June and then a 1420 in October would have been counted as a 1420. Since most colleges consider the best performance or participate in Score Choice, this student would have shown up as (at least) a 1450 scorer in admission offices. A large number of competitive colleges now superscore SAT results. A superscore combines a student’s best Evidence-based Reading performance with her best Math performance, even if the scores come from separate sittings.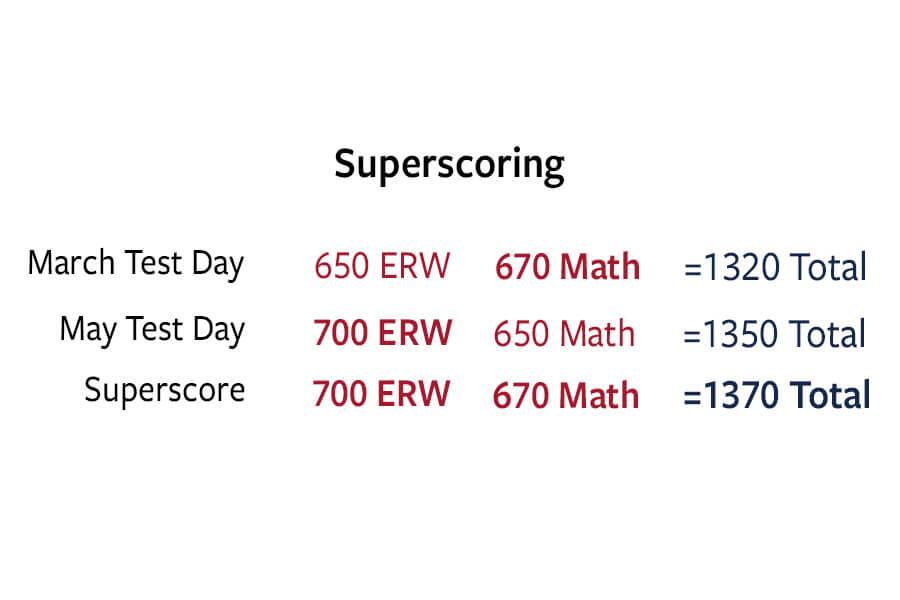 Research from College Board indicates that “most recent” accounting is, for students who take the SAT more than once, approximately 20 points lower than “highest single administration” scoring and 30 points lower than superscoring. The more students repeat the exams, the higher this figure grows. High-scoring students tend to repeat the SAT and ACT more than low-scoring students, so the impact of repeat testing is magnified at the upper levels. About two-thirds of re-testers have superscores that are higher than their best single administration scores.
Compass estimates that highest combined and superscoring policies increase the number of students in the top score ranges by 15–20%. While College Board may report that 145,000 students scored 1400–1600 in the class of 2018, college applications likely reflected at least 170,000 students in that range. ACT reports 135,000 students in the 31–36 range. A real world estimate would be closer to 160,000.
Isn’t this all just score inflation related to the new SAT?
College Board completely overhauled the SAT in March 2016. By comparing how a pilot group of students performed when taking both old and new SATs, a concordance was developed between the two exams. Overall, the concordance showed—and further studies confirmed—that scores were higher on the new SAT. However, the changes seen in 2018 are separate from that score restructuring. Using the structure and scoring of the new SAT to explain this year’s developments has several flaws:
- The class of 2017 report is based on new SAT data. Score inflation should have already been accounted for.
- Score inflation decreases at the high end of the range. While a student scoring 900–1100 on the old test would be likely to score 80 to 100 points higher on the new exam, the same cannot be said for students at 1400–1600. In fact, there is little difference at all above about 1450.
- The old SAT and the ACT have had an increasing number of high scoring students for many years. The trend is real; 2018 is an outlier because of the scale of the change, but it fits well with the overall pattern.
What will happen for the class of 2019?
The trend of more students reaching the top tiers is unlikely to reverse. Early indications, though, are that the giant leaps seen last year will not be repeated. PSAT scores can serve as a leading indicator of score changes. While the class of 2018 saw large changes at the top end of PSAT scores, the class of 2019’s PSAT results showed modest increases. Early SAT dates reflect small average improvements for this year’s class. As noted previously, though, average scores can mask changes in high and low scores. None of the available figures indicate that the number of top scores will decline.
High score growth on the ACT also continues. While it slowed this year, that was partly the result of an overall decline due to lost state contracts. We expect the class of 2019 to show increases, particularly for elite scores.
At the most competitive colleges, high test scores can be viewed as “necessary but not sufficient.” It is extremely difficult to gain admission to Stanford with a low SAT score, but getting a great score is far from a guarantee of admission. The net effect of the growth at the top ranges is to make a high score more essential but less sufficient.
After the dust settles each April, we often hear that “this was the worst year ever.” For 2018, that assessment feels fair. ACT and SAT scores at colleges have trended up over time, but it’s not simply higher scores that create anxiety—it’s also the added unpredictability. The combination of increased applicant numbers at competitive colleges and a higher percentage of top scores magnify the uncertainty that students experience. Fortunately, hundreds of thousands of students who experienced this anxiety last April are off and thriving at college and looking forward to homecoming. And 2019 will be the worst year ever, until it isn’t.
hi Art – Thank you for the article. I have a question which is related to the topic. My son took ACT twice and he got a composite score of 35 in second test and composite score of 34 in the first one. His super score is 36 which is good for the schools looking at the super score. In the test he got 35, the score for both Math and Science is 33. We are wondering if the score of 33 for both Math and Science will not be competitive for the highly selective schools like Northwestern, University of Chicago, Washu. We are debating whether to take the test one more. Can you shed some light on how the admission office will look at the lower score for stem subjects?
ILDad,
I’m hesitant to generalize on a topic where there can be disagreement even within an admission office, let alone among a diverse set of colleges. But let me generalize anyway. The idea of a composite score is that there is inevitably some variability in scores between subjects. Your son’s 35 with a STEM score of 33 does not mean less than a student with a 35 and English and Reading scores of 33. The obvious exception would be if your son is applying with an eye toward science or engineering. With a single test score of 35 and a superscore of 36, I’d recommend your son put down the number 2 pencil and look at the other aspects of his application.
Hello Art,
In this article you mentioned that the new 2018 concordance might not be accurate due to a change in the composition and number of people earning higher scores. If this is true, do you think the concordance needs to be promptly updated? If so, do you think that the concordance will be much harsher (i.e. 1400 concording to a 29, 1430 to a 31, etc.)? Do you recommend instead that we use the old 2016 SAT/ACT concordance tables?
Bob,
Realistically, there is no chance that the concordance will be updated until there is a change in one of the tests. College Board and ACT hate each other. They cooperate only when it is absolutely necessary. The best advice is to make decisions based on the current concordance, which is absolutely an improvement over the 2016 concordance.
However, do you believe that the concordances need to be changed?
In addition, do you believe that the old to new SAT concordances are accurate?
As with the original ACT/SAT concordance the old SAT/new SAT concordance was based on pilot data. So it is flawed (not so flawed as to be horrible, but it’s nice that it no longer matters). Unlike the improved SAT/ACT concordance, there was no obvious way to improve the Old/New concordance, since the tests were not offered to the same students at the same time. College Board also had no incentive to change the concordance after its initial usefulness had been served. While using the concordance creates some continuity in the history of the “SAT”, the new test is actually so different as to be discontinuous. Every other SAT content and scale change had been performed via equating, because sufficient content overlap existed. The old SAT is about as different from the new SAT as the new ACT to the old SAT.
A concordance is an imperfect tool. The better it reflects the actual applicant pool, the more relevant it is. Keep in mind that this statement also means that a “perfect” concordance nationally is not necessarily perfect for a particular college. The developer of a concordance can’t escape the fact that it is a way of comparing two different tests.
I like accuracy, so I certainly wouldn’t object to a new concordance. Is it needed? Probably not. The changes we’d likely see would likely be no more than 10-20 points in either direction (and many comparisons would likely remain unchanged). And you still can’t escape the inadequacies of a concordance.
The mere fact that there are more high scores — either ACT, SAT, or both — does not invalidate a concordance. It’s how the same students perform across both tests that matters.