[Part 2: Score Discrepancies is the second of a three part report on the new PSAT. See Overview, Part 1: Percentile Inflation, and Part 3: Lowered Benchmark. The entire report can also be downloaded or distributed as a PDF.]
Part 2 : Score Discrepancies
An historically narrow gap between sophomore and junior performance does not seem credible and leads to questions about how scoring, scaling, and weighting were performed and reported.
Sophomore Versus Junior Score Discrepancies Call Scoring Methodologies into Question
Percentile inflation caused by redefinition and re-norming creates unfortunate misinterpretations, but the sources of the change can be readily identified; previous percentile tables can be restated based on the new definition; the difference between Nationally Representative percentiles and User percentiles can be compared to gauge the difference added there. However, without further information from College Board it is impossible to know the accuracy of the 11th and 10th grade percentiles. Our analysis shows that there are significant problems in the way the numbers are being presented that mask the very thing the new test was meant to reveal — college readiness and academic progress. If score results between grades are suspect, it leads to questions about the pilot studies that were performed and how they inform the scoring for the PSAT and SAT.
Expected Versus Observed Score Differences Between Grades
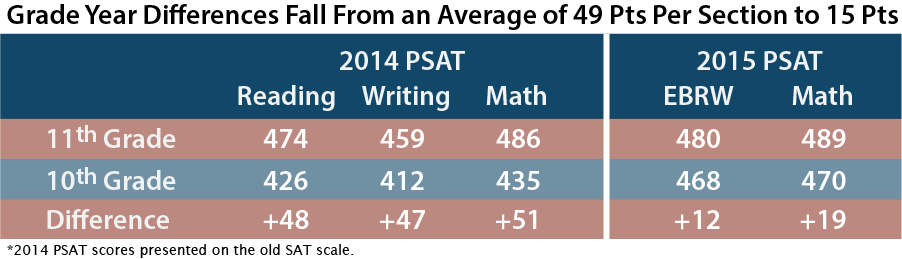
Historically, juniors have outperformed sophomores on the PSAT/NMSQT by approximately 5 points per section [see table below]. Translated into SAT scores, the differences between 10th and 11th graders in 2014 were 48 points, 47 points, and 51 points in Critical Reading, Writing, and Math, respectively. On the new PSAT, however, the reported difference is only 12 points on Evidence-Based Reading and Writing (EBRW) and 19 points in Math. The average difference in 2014 is more than 3 times that seen in 2015. The 2014 grade differences were in line with those seen over the last decade, so they were not anomalous. The old and new PSAT are different tests, but student growth tends to show up similarly even on different college admission exams.
Are Low Score Discrepancies Due to Differing Testing Populations?
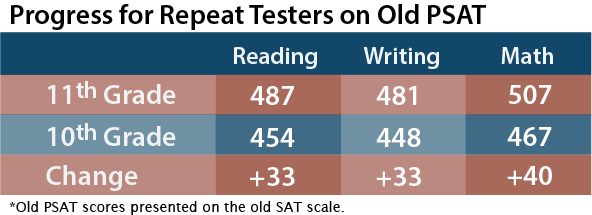
Not all sophomores and juniors take the PSAT. Some take the PSAT as mandatory testing; some take the PSAT in order to qualify for National Merit; some take the ACT Aspire instead of the PSAT. If College Board’s calculation of a nationally representative sample is correct, though, this year’s grade differences should be immune from differences in test-taker demographics. Previous PSATs lacked a nationally representative sample, so sophomore to junior comparisons may be distorted by test-taker patterns. A way of removing potential distortion is to look at the results only for repeat testers — students who took the test in both school years. College Board has done research on the typical score change on the old PSAT by analyzing only students who took the test as sophomores and repeated the test as juniors [see table below]. The average increase, expressed in SAT points, was 33 points in Critical Reading, 33 points in Writing, and 40 points in Math. The figures are still twice what is being shown on PSAT reports as the 10th grade to 11th grade score differential.
Do Content Differences Between Old and New PSATs Provide an Explanation?
A remaining problem is that the old PSAT is not the new PSAT. Although the new and old tests cover roughly the same score range and do not have radically different means or standard deviations, we cannot be certain that year-over-year growth is identical. A third set of data is College Board’s own estimates of growth. Below are the College and Career Readiness Benchmarks.
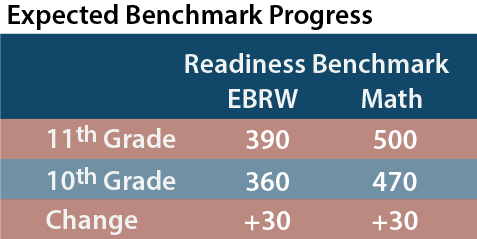
College Board assumes that students improve at roughly 30 points from sophomore year PSAT to junior year PSAT and another 20 points from junior year PSAT to SAT. The PSAT figures — which themselves seem conservative — are still twice that shown in the 2015 student data.
Percentile Data for Sophomores and Juniors May Prove the Existence of Errors in Presentation, Computation, or Norming
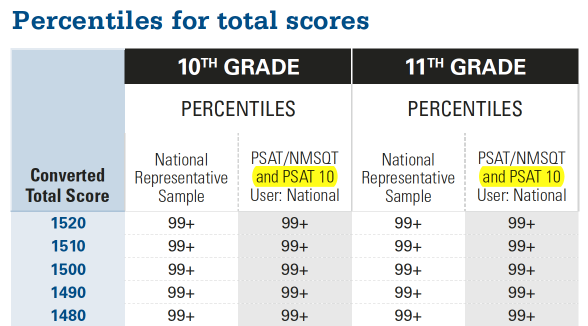
The low observed score differences between 10th and 11th graders do not fit into a historical pattern, match studies of repeat testers, or align with assumed College Board benchmark progress. As improbable as the small point discrepancy is, though, it seems impossible to go one step further and state that sophomores outperform juniors. But this is exactly what the published percentile tables show [below].
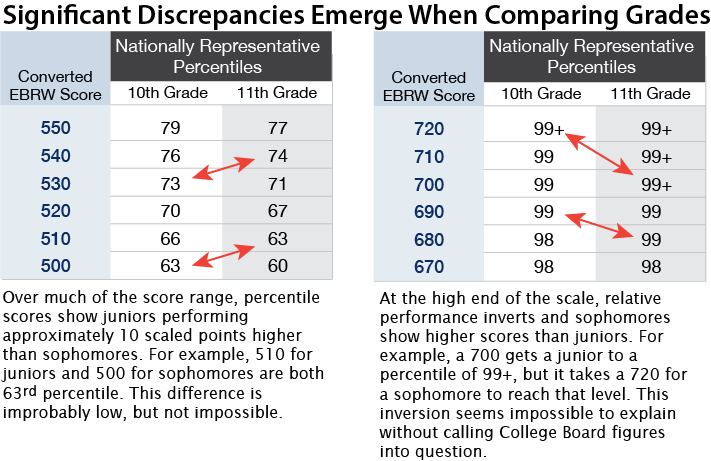
As you move up the scale, the difference between 10th and 11th graders disappears and then turns in favor of the younger students. Read literally, the score tables say that more sophomores than juniors achieved top scores on the PSAT/NMSQT. There have always been talented sophomores who score highly on the PSAT, but as a group, these students should not do better on the PSAT in 10th grade than they do in the 11th.
These figures are for the Nationally Representative groups, so cannot be explained away by saying that the test-taking populations are different. There is no logical statistical or content explanation as to how sophomores could actually perform better than juniors. In fact, we should be seeing scores 30-50 points higher per section for juniors. The most likely explanation is that the surveying and weighting methods used for the PSAT did not properly measure the class year compositions. If we assume this to be the case, though, can we be assured that the studies did any better in measuring the intra-class composition? Will the SAT be immune from the same problems?
Can Anything Explain the Low Sophomore/Junior Score Differences and the Score Inversion?
A suspect in the mix is the PSAT 10. Although the content of the PSAT 10 is identical to that of the PSAT/NMSQT, it is positioned as a way for schools to measure how students perform near the end of the sophomore year rather than toward the outset of the year. The PSAT 10 will first be offered between February 22 and March 4, 2016. It is a safe assumption that spring sophomores, adjusted for differences in the testing pool, will score higher than fall sophomores. If College Board statistically accounted for PSAT 10 takers in their figures, the scores for sophomores would be inflated.
It seems academically inappropriate to lump PSAT/NMSQT and PSAT 10 scores into the same bucket. The tests are taken at different phases of a student’s high school progress. In fact, one reason a PSAT 10 exists is because spring performance differs from fall performance. The only clue that College Board may have made such a combination is reproduced from its Understanding Scores 2015. Highlighting has been added.
It’s likely that this reference is simply the result of a production error. The document never makes this reference again in its 32 pages. In short, all figures likely measure October performance for sophomores and juniors. This final attempt to explain the anomalous supremacy of sophomores comes up short. Even had a PSAT 10 explanation proved successful, it would have raised more questions than it answered.
Tables surrounding the PSAT are all marked as “Preliminary.” College Board has made clear that final scaling for the redesigned SAT (and the PSAT is on the same scale) will not be completed until May 2016. Final concordance tables between old and new tests will replace any preliminary work. If the explanation of the statistical anomalies is that the paint is not yet dry, it begs the question as to what 3 million students and their educators are to do with the scores they have been presented. The new PSAT reports are the most detailed that have ever existed. They have total scores, section scores, test scores, cross-test scores, sub-scores, Nationally Representative percentiles, User percentiles, SAT score projections, sophomore and junior year benchmarks, and more. Which parts of the reports are reliable and which parts remain under construction? Should educators simply push these reports aside and wait until next year? Should students make test-taking and college choice decisions based on these scores?
The 10th and 11th graders probably scored so similarly because the new PSAT is too easy. Not very many test takers get very many questions wrong, and without deductions for incorrect guesses the effect on scores is enhanced. The PSAT can’t be used to differentiate between good/great/excellent students–just as pretty much all college-bound students get straight A’s now, arguably too many of them score in the 99th percentile. Score compression, score inflation… that’s what you get. And college admission more closely approximates a lottery. (Or backgammon, perhaps.)
Never even mind the nationally-representative samples and the revised definition of percentiles–which are interesting but probably don’t actually harm children. I think that low expectations from external sources (see: easy test) and self-imposed pressure to avoid even the smallest mistake (kids know that when everyone else seems to get perfect test scores and grades, one wrong answer puts them way out of contention) harm children.
Katy,
The high number of students attaining 99th percentile scores has more to do with the poor sampling done by the College Board than with the ease of the test. The new PSAT seems to be hard enough to distinguish among students in the 700’s. The old PSAT had a distinct disadvantage — it had to go to 800 (80, but it’s easier to add the zero). The problem was that the test content was too easy to reach that goal effectively. That’s why we often saw students fall 40-50 points for 1 wrong in Math or Writing and as many as 60, 70, or even 80 points points for 2 wrong. Because an answer sheet with no incorrect answers has to receive a perfect score, an 800 was an inflated score. The PSAT was promising results it could not deliver. The 160-760 range is a better fit with the material tested on the PSAT. We can see from the scaling tables that students are missing questions in expected ways.
The 10th-grade scores may be higher than anticipated as the group of students taking the psat in 10th grade is probably somewhat self-selected. The students who are more likely to do well on the psat are also probably more likely to take the psat early (in 10th grade), thus increasing the average.
Bob,
Self-selection can certainly have unexpected impacts, but the sophomore group actually tends to be lower-performing because there is a higher portion of state-funded testing that includes all students. For example the 90th percentile for 10th-grade test-takers is 1180, whereas it is 1280 for juniors (this difference is greater than to 60-70 point growth generally seen between class years). This original post involved the percentiles presented by College Board back in 2015 and that were based on pilot results. They have proved to be as unreliable as predicted. More accurate percentiles — at least for test-takers — are reflected in PSAT/NMSQT – Understanding Scores 2017.
Hi Art ,
My child did the PSAT in 2017 (8th grade – 1030) and got 1090 in 9th grade. There isn’t much progress even when we cannot really interpret the score. We just know that 1200 and above is what is good enough and desired. Are we correct?
Michael,
The average improvement is 30-40 points on each side of the test or about 60-70 points per year, so your student’s progression is not unusual. There is no real cutoff for “good enough” as it really depends on the colleges to which one is applying. Some schools have average scores above 1500, but the majority of colleges are below 1200. I don’t know if you were provided with 9th grade percentiles with your child’s report. My guess that it is somewhere between the 70th and 80th percentile.