
This page has been retained as an archive. For the latest information about Semifinalist cutoffs in future classes, please visit Compass’ National Merit Semifinalist Cutoffs page.
MAJOR CHANGE FOR FUTURE SEMIFINALISTS: The big news for juniors taking the PSAT in October 2018 is that they are the first class that will be able to use ACT scores as “confirming scores” in the Finalist round of the competition. This is a long overdue change, as many high-scoring ACT students have had to take the SAT for no reason other than National Merit’s rules. This does not apply to members of the class of 2019, who must still take the SAT if they want to move from Semifinalist to Finalist status. We will be updating our National Merit FAQ as more information becomes available over the next year.
Compass has now confirmed all of the National Merit cutoffs for the class of 2019. They range from the national Commended Student cutoff at a PSAT Selection Index of 212 all the way to the 223 Selection Index cutoff in California, Maryland, Massachusetts, and New Jersey. A full analysis of how and why things changed for the class of 2019 can be found below.
The last few years have been unusual ones for National Merit. With the October 2015 PSAT, College Board introduced an entirely redesigned exam and scale, and the Commended Student cutoff came in at 209. The October 2016 PSAT resulted in even more changes: the Commended Student cutoff moved to 211, and Semifinalist cutoffs increased in forty-six of fifty states. The class of 2019 has also seen scores rise, but in a more limited fashion. [Our National Merit FAQ has more information about the overall process, and we have an in-depth selection of related posts.]
September 22 Update — The 2019 essay prompt for the Finalist application has been confirmed: To help the reviewers get to know you, describe an experience you have had, a person who has influenced you, or an obstacle you have overcome. Explain why this is meaningful to you. Use your own words and limit your response to the space provided.
The maximum length is based on size rather than word count; your essay will probably need to be no more than 600-650 words. Be sure to do a PDF preview.
September 12 Update — NMSC releases the names of Semifinalists to the press today. There is no nationwide release, and not all press outlets publish the statewide lists. We will add links as they become available. Some high schools also use this public release date as a time to notify students.
Alabama, Arkansas, California, Delaware, District of Columbia, Florida, Idaho, Illinois, Indiana, Louisiana (Jefferson Parish), Maine, Maryland, Michigan (Washtenaw), Minnesota, Nevada, New Jersey, New Mexico, New York, Ohio (Cincinnati area), Oklahoma (Northeast), Oregon (Portland-area only), Pennsylvania, Texas, Virginia (Fairfax, Loudon), Washington, Wisconsin (Madison)
August 30 Update — All 50 states have now been confirmed. The highest cutoffs ended up at 223 with Massachusetts, Maryland, and California joining New Jersey and DC at that figure. The actual cutoffs for the class of 2019 can be found in the table below. As expected, there was some upward movement in scores, but nothing like the jump in cutoffs seen last year. Forty-five states were within 1 point of their class of 2018 cutoffs (twenty-one unchanged, sixteen up 1 point, and eight down 1 point). Three states saw 2-point increases, 2 states had 2-point declines. Rhode Island was the outlier with a 4-point increase to a cutoff of 220. Rhode Island had been the outlier for the class of 2018 by being the only state with a lower cutoff.
The button to view older posts does not function correctly. A reader contributed the following hack: You can put in the page # of the comments like this: https://www.compassprep.com/national-merit-semifinalist-cutoffs/comment-page-29/. Just change the 29 to move forward or backward in comments.
August 29 Update — There is now contradicting information regarding PA, and the cutoff may be at 220. GA is at 220. A student at 221 qualified in IL.
One of the biggest question marks left from Tuesday is where CA’s cutoff will end up. We have a very credible report that 222 did not qualify and another that 224 did qualify. This means the cutoff is at either 223 or 224. I strongly believe that CA will not go to 224, but it is not yet foreclosed. So far we are seeing more upward movement than downward. CT, PA, and TN are confirmed and are up 1 point from last year. TX will stay at 221. OK will be down from last year, and AL, AR, FL, and OH can be no higher than last year. KY and MS will also be up.
August 28 Afternoon Update — We have pinned down 4 states and received reports from 17 states. I’ve moved most of the information forward to the kickoff commentary for the 29th.
August 27 Update — Reports seem to be arriving in some mailboxes today. As states are recorded below, the <=, =, and > signs will be used to indicate what we know about the cutoffs. For example, a homeschooler reported that 221 qualified in TX. That does not yet mean that 220 did not qualify. So we know the cutoff is less than or equal 221.
August 22 Update — Semifinalist announcements mailed to schools: Wednesday is a big day, because announcements will finally go out. Except in the case of home-schooled students, notifications are sent to schools. Students will only be able to find out their official status from counselors or principals. I will be maintaining a list of state cutoffs as they are narrowed down. I do my best to stay on top of all comments and make regular updates to this page. Please note if you would like your comment to remain private. Reporting your results — once you receive notification from your school — will help other students. I am particularly appreciative of reports from students who miss the Semifinalist cutoff. The students reading this page have done well on the PSAT, and that is true whether or not they are named Semifinalists.
Although schools are not obligated to wait, many choose to delay student notifications until the public announcement of Semifinalists on September 12.
April 6 Update — Confirmation of National Merit Commended Student Level at 212: For the class of 2019, the Commended Student cutoff has moved one point above last year’s 211. The 212 Commended Student cutoff was what we expected based on our analysis of PSAT results. We have updated the estimated Semifinalist cutoffs based on this information. Because the 212 Commended cutoff was already expected, most estimated ranges have not changed. We continue to believe that the majority of states will see no change or one point increases versus class of 2018 Semifinalist cutoffs. Less common will be two point increases or one point declines. Larger changes are likely to occur in only a handful of states. [The table below is now based entirely on the actual cutoffs for the class of 2019.]
February 11 Update: Students eligible for the National Hispanic Recognition Program have been notified. Since initial NHRP qualification is based on PSAT/NMSQT scores, I am often asked how the results impact predictions for National Merit cutoffs. For the class of 2018, Compass has the qualifying scores for only the South and Southwest regions. For the class of 2019, we have all regions except New England. Optimists will note that the Southwest’s cutoff went down 10 points this year (NHRP uses PSAT Total Scores rather than the Selection Index). Pessimists will note that the South’s cutoff went up 10 points, which would translate to 1-2 SI points. Realists will note that NHRP scores — especially since they are neither state-based nor representative of the entire pool of PSAT-takers — are not good predictors. There is no clear trend, so NMSF cutoff predictions remain unchanged. See Compass’ NHRP post for details.
| State | Class of 2019 | Change | Class of 2018 | Class of 2017 |
|---|---|---|---|---|
| Alabama | 216 | 0 | 216 | 215 |
| Alaska | 215 | -2 | 217 | 213 |
| Arizona | 220 | 0 | 220 | 219 |
| Arkansas | 214 | -1 | 215 | 213 |
| California | 223 | 1 | 222 | 221 |
| Colorado | 221 | 1 | 220 | 218 |
| Connecticut | 222 | 1 | 221 | 220 |
| Delaware | 222 | 1 | 221 | 218 |
| District of Columbia | 223 | 0 | 223 | 222 |
| Florida | 219 | 0 | 219 | 217 |
| Georgia | 220 | 0 | 220 | 219 |
| Hawaii | 220 | 0 | 220 | 217 |
| Idaho | 214 | -2 | 216 | 214 |
| Illinois | 221 | 0 | 221 | 219 |
| Indiana | 219 | 0 | 219 | 217 |
| Iowa | 216 | 0 | 216 | 215 |
| Kansas | 218 | -1 | 219 | 217 |
| Kentucky | 218 | 1 | 217 | 215 |
| Louisiana | 217 | 1 | 216 | 214 |
| Maine | 217 | 2 | 215 | 214 |
| Maryland | 223 | 1 | 222 | 221 |
| Massachusetts | 223 | 1 | 222 | 222 |
| Michigan | 219 | 0 | 219 | 216 |
| Minnesota | 220 | 0 | 220 | 219 |
| Mississippi | 215 | 2 | 213 | 212 |
| Missouri | 217 | 0 | 217 | 216 |
| Montana | 214 | 0 | 214 | 210 |
| Nebraska | 216 | 1 | 215 | 215 |
| Nevada | 218 | 1 | 217 | 214 |
| New Hampshire | 219 | 2 | 217 | 216 |
| New Jersey | 223 | 0 | 223 | 222 |
| New Mexico | 215 | 0 | 215 | 213 |
| New York | 221 | 0 | 221 | 219 |
| North Carolina | 220 | 1 | 219 | 218 |
| North Dakota | 212 | 1 | 211 | 209 |
| Ohio | 219 | 0 | 219 | 217 |
| Oklahoma | 215 | -1 | 216 | 213 |
| Oregon | 221 | 1 | 220 | 219 |
| Pennsylvania | 220 | 1 | 219 | 218 |
| Rhode Island | 220 | 4 | 216 | 217 |
| South Carolina | 216 | -1 | 217 | 215 |
| South Dakota | 215 | 0 | 215 | 209 |
| Tennessee | 219 | 1 | 218 | 218 |
| Texas | 221 | 0 | 221 | 220 |
| Utah | 215 | -1 | 216 | 215 |
| Vermont | 216 | -1 | 217 | 215 |
| Virginia | 222 | 0 | 222 | 221 |
| Washington | 222 | 0 | 222 | 220 |
| West Virginia | 212 | 1 | 211 | 209 |
| Wisconsin | 216 | -1 | 217 | 215 |
| Wyoming | 212 | -1 | 213 | 209 |
| U.S. Territories | 212 | 1 | 211 | 209 |
| U.S. Citizens Studying Abroad | 223 | 0 | 223 | 222 |
| Commended Student | 212 | 1 | 211 | 209 |
Will the class of 2019 see still higher cutoffs or will scores settle back to earlier levels?
[Actual results have now been confirmed in the table above.] Compass’ working hypothesis has been that the higher October 2016 scores are more representative of future results. The 2015 PSAT was a rushed effort, and College Board was still refining the SAT scale. After crunching the numbers for the current PSAT, we believe that the hypothesis is correct and that — at least on a national level — there may still be upward pressure on scores. Compass estimates that the Commended level could rise to 212 [this rise has now been confirmed. Ed.].
Did scores on the October 2017 PSAT change significantly from those on the October 2016 PSAT?
The percentiles and average scores shown on the PSAT/NMSQT score report and in the Understanding Scores publication do not actually pertain to the class of 2019. All of the normative data are from previous class years. Instead of using these sources, Compass has turned to the score information made available to schools.
The average score for the class of 2019 declined 4 points from the 1019 total score seen for the class of 2018.
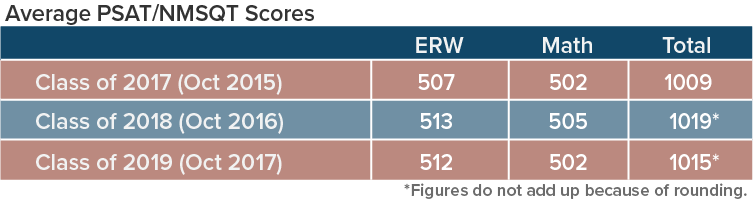
Average scores, though, do not give an excellent indication of what is happening at the high end of the score range where Commended and Semifinalists cutoffs are determined. More relevant are the results for students in the 1400 to 1520 score range.
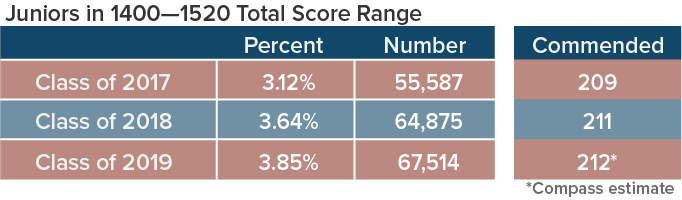
Both the percentage of test-takers and the absolute number of test-takers in the 1400-1520 score range increased this year. The increase, however, was notably smaller than that seen the previous year. We believe that these results point to a Commended Student cutoff of 211 or 212 for the class of 2019 [now confirmed as 212. Ed.].
National results do not determine the state cutoffs.
While there is a rough correlation between upward movement in the Commended level and upward movement in state cutoffs, it is not a one-to-one relationship. Additional students taking the PSAT in Illinois or more top scorers in New Jersey — as hypothetical examples — have absolutely no effect on the cutoff in California.
New Jersey (and, by extension, DC and U.S. students abroad) will continue to have the highest cutoff.
The high-water mark is likely to remain at 223. We believe that a 224 cutoff is a remote possibility, and a drop back to 222 is not eliminated. A cutoff higher than 224 is, simply, not a possibility in any state or selection unit. We believe that cutoffs on the redesigned PSAT reach a natural limit. A “lopsided” student has a much harder time of reaching a top SI. On the old PSAT, a strong math student might score a 720 CR, 800 M, and 720 W and reach an SI of 224. A top-notch verbal student could have a mediocre Math score and still reach 224 (800 CR, 640 M, 800 M). On the new PSAT, a perfect scoring EBRW student must now pair that performance with an excellent Math score to reach the same level (760 EBRW and 720 M). While it is possible that a state might eventually hit a 224 Semifinalist cutoff, we think it is unlikely.
The best estimate is still a weak bet.
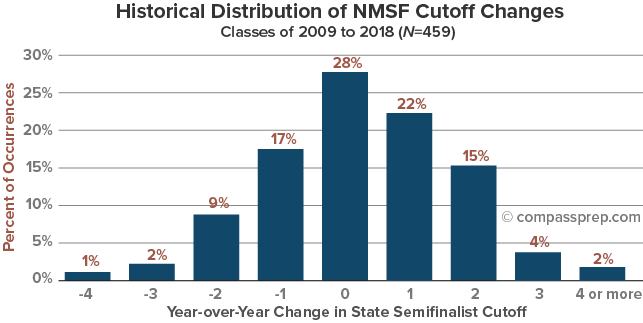
Compass has repeatedly shown that, in the absence of definitive movement in the Commended level, the best estimate of a state’s future cutoff is the current cutoff. However, even that best estimate is only correct 28% of the time. The chart below reflects historical changes in cutoffs over the last decade (adjusted for the scaling change of the new PSAT).
Changes are not equally distributed across all states. High scoring states, in particular, have more stable cutoffs than those with cutoffs near the Commended level. The standard deviation for the cutoffs in the dozen highest scoring states (which also represent 4 of the 5 largest states) is approximately 1. The standard deviation among the lowest scoring states is approximately 2.
Large states see more stability than small states.
The 9 states that saw 3-point or greater increases for the class of 2018 had a total of about 1,100 Semifinalists. California, in comparison, has almost twice that number. Large numbers bring stability. The largest state seeing a 3-point increase last year was Michigan, which switched from being an ACT state to being an SAT state. Illinois has made a similar transformation, and there may still be some upward movement.
If the Commended level does increase by a point this year, does it mean that all of the estimates go up by a point?
Historically, a one point change shifts the curve slightly so that there is a toss-up — across all states — between no change and a 1 point increase. Since we expect the Commended level to remain the same or increase by a single point, we believe that the most common situation will be “no change.” As seen in previous years, we expect a lower likelihood of change in the highest cutoffs and in the largest states. A few states have “hand-tuned” estimates based on historical patterns. Understanding the inevitable distribution of changes can help students and parents better appreciate why Compass presents estimated ranges and why a “most likely” can be “best” and “weak” at the same time.
Why are score changes so much smaller at the high end?
Even in this “up year,” only New Jersey saw a cutoff of 223 (cutoffs for DC and U.S. students studying abroad are based on the highest scoring state). Several more states were bunched up at 222. These results lend credence to the theory that cutoffs on the redesigned PSAT reach a natural limit. A “lopsided” student has a much harder time of reaching a top SI. On the old PSAT, a strong math student might score a 720 CR, 800 M, and 720 W and reach an SI of 224. A top-notch verbal student could have a mediocre Math score and still reach 224 (800 CR, 640 M, 800 M). On the new PSAT, a perfect scoring EBRW student must now pair that performance with an excellent Math score to reach the same level (760 EBRW and 720 M). While it is possible that a state might eventually hit a 224 Semifinalist cutoff, we think it is unlikely. Unless the test undergoes dramatic changes, we believe that it is impossible for a cutoff to ever reach 225.
Cutoffs increased for the class of 2017 and have now increased again. Will they keep going up? In both cases, the College Board played a larger role than did test-takers in overall score changes. There is not yet evidence that scores are on the rise for future years. In fact, we think it is the least likely case – although not by a large margin – when choosing among “no change,” “lower scores,” and “higher scores.”
Nationally, the ability levels of the top 16,200 students among 1.5 million NMSQT participants is relatively static over any mid-term window. The change for the class of 2017 was as expected as it was dramatic. The PSAT underwent a complete overhaul. The elimination of the guessing penalty and the reduction in multiple-choice answers helped “inflate” most scores. The shift from 200-800 scoring per section to 160-760 per section slightly lowered the top end.
What, then, caused scores to rise for the class of 2018?
There have been a number of theories to explain the increase in PSAT scores for the class of 2018. Test-takers for the 2016 PSAT had the advantage of additional practice materials, improved test preparation, and increased familiarity (many took the redesigned PSAT as sophomores in 2015). While any or all of these factors may have had some impact, Compass’ research points to PSAT scaling imperfections or irregularities as the more likely cause.
College Board’s goal is to make sure that PSAT scores from one year are comparable to PSAT scores in another year. It has not always met that goal. It faced a more difficult task than usual for the October 2015 and 2016 PSATs, because the scales were in flux and several PSAT problems had to be discarded as invalid. The fact that 46 of 50 states saw increased cutoffs and that PSAT scores increased for sophomore and juniors at essentially all ability levels means that student-specific factors such as increased preparation do not adequately explain the changes. The rise in cutoffs does not reflect an inexorable increase in scores. While cutoffs fluctuate from year-to-year, a longer view shows that there has not been a national trend toward higher scores. That claim cannot be made as universally at the state level. In-migration and economic growth help fuel competition for Semifinalist slots, which is why a state such as Texas has seen an upward trend over the last decade. Michigan is an example of where heightened attention to the PSAT can raise scores quickly. Even at the state level, though, it is unwise to focus on year-over-year changes as an indicator of future results.
Why do states have such different cutoffs?
Cutoffs vary across the country because the approximately 16,200 Semifinalists are allocated proportionally to states based on the total number of juniors in a class. The table at the top of the page shows how many Semifinalists from the class of 2016 were recognized in each state. A state’s cutoff is derived by finding the score that will produce, as closely as possible, the targeted number of Semifinalists. Students in any given state are competing only against fellow residents. The test is national, the competition is local.
Is it just my imagination or do PSAT scores bounce around more than SAT scores?
It is not your imagination. While approximately the same number of students take the PSAT each year as take the SAT, there are crucial differences. Every student takes one of two PSAT/NMSQT forms on one of two dates in October (technically, there is a third, “alternate,” form and date). SATs have more dates, more forms, and students take and retake them throughout the year. The relative homogeneity of the PSAT means that it is highly susceptible to shifts, as there is no averaging out of differences. The size and direction of these shifts, though, cannot be predicted in advance. If they could be, College Board would take steps to prevent them.
Semifinalists — or prospective Semifinalists — may want to visit the Compass National Merit FAQ to understand more about the National Merit Scholarship Program and the steps along the way.
Hello,
What this means? The ACT will be added to the PSAT score?
MAJOR CHANGE FOR FUTURE SEMIFINALISTS: The big news for juniors taking the PSAT in October 2018 is that they are the first class that will be able to use ACT scores as “confirming scores” in the Finalist round of the competition. This is a long overdue change, as many high-scoring ACT students have had to take the SAT for no reason other than National Merit’s rules.
Julie,
Sorry if the wording is confusing. Only the junior PSAT is used in choosing Semifinalists. It’s at the next stage — qualifying as a Finalist — where students can now use either the SAT or ACT to achieve a “confirming score.”
Hi Art,
Thank you for taking time out of your schedule to answer questions.The quality and breadth of your responses are quite impressive. My son took the PSAT/NMSQT in Oct 2018 as a 9th grader (Class of 2022). He scored a 1460 with an SI of 218. Will he get a commendation letter or will the College Board only recognize Juniors? We live in Austin, Texas.
PJ,
Thank you. The NMSQT is just for juniors (and sophomores graduating a year early). While your son won’t receive any NM recognition this year, those are great scores for a freshman!
Please excuse my question but I want to ask what is S1 218 score Pj is talking about?
Simona,
National Merit does not use the straight total score. Instead, it puts twice the weight on the ERW score. In the case of PJ’s student, the total score of 1460 would have been 720 ERW and 740 M. The ERW is doubled (without the zero) to 144 + 74 = 218.
My girl got 223 index score, it’s so exciting to wait for list of semifinalist!
from Texas.
What happened to the 2020 national merit information being reported by parents
Noreen,
Some crossed wires. The correct post is back up at https://www.compassprep.com/national-merit-semifinalist-cutoffs/.
Unable to access – National Merit Semifinalist Cutoffs Class of 2020
It is redirected to National Merit Semifinalist Cutoffs Class of 2019
Please help.
Problem fixed. My apologies.
Where can I find the list of the commended students?
Simona,
I have never seen a full list of commended students published.
Thank you,
And I have, maybe, a dumb question. Can be possible that a student with a score of 1400 be commended and one with 1410 not?
Simona,
I may have just given you the answer in another part of the thread, but let me go ahead and mention it here, too. Because the ERW is doubled when calculating the Selection Index, two students with 1400’s could have different SI’s. The Commended cutoff was 212. A student with a 720 ERW and 680 M would have qualified: 72×2 + 68 = 212. On the other hand, a student with a 1410 might have missed the cutoff if she had a split of 700 ERW 710 M (70×2 + 71 = 211).
Thank you for the explanation. Yes, that’s actually the case with my son:). I had to understand how these scores are calculated. Thank you again.