Comparing SAT and ACT Scores—Official New Concordance
NEW! College Board and ACT have released official concordance tables to convert SAT and ACT scores. Compass has developed easy-to-use tools to help you compare your scores and make informed decisions about test prep. Use the Compass concordance widget below to quickly access your newly converted score.
Below, you’ll find an overview of how the new concordance affects scores, widgets for comparing and converting scores between the SAT and ACT, downloadable PDFs of our comparison graphs and tables, and the new concordance tables themselves.
Click here to watch Compass Co-Founder Adam Ingersoll host a webinar that explains the new concordance and what it means for counselors and families.
Download the Compass Prep app for iPhone or Android for even more planning tools for parents, students, and counselors.
Interested in learning more about why these changes occurred, how they affect your score, and what we expect colleges to do with the new tables?
Changes to the Concordance
The new SAT and ACT concordance has little impact on the scores of students who scored in the middle ranges. Most high-scoring SAT test takers will be pleased to find that their ACT scores are a point higher when they convert with the new concordance. That means, however, that high-scoring ACT students will now see lower SAT scores when they convert with the new concordance. Roughly 70% of students in the upper range are affected. In brief:
Click to view detailed tables for the exact concordance values at your SAT score.
SAT to ACT – How Things Changed
If you took the SAT, find your score in the first column. The second column is your converted ACT score with the new concordance; the third is your converted ACT score with the old, 2016 concordance. The change in ACT points from old to new concordance is listed in the final column.
SAT | ACT (2018) | ACT (2016) | Change |
---|---|---|---|
1600 | 36 | 36 | 0 |
1590 | 36 | 35 | +1 |
1580 | 36 | 35 | +1 |
1570 | 36 | 35 | +1 |
1560 | 35 | 35 | 0 |
1550 | 35 | 34 | +1 |
1540 | 35 | 34 | +1 |
1530 | 35 | 34 | +1 |
1520 | 34 | 34 | 0 |
1510 | 34 | 33 | +1 |
1500 | 34 | 33 | +1 |
1490 | 34 | 33 | +1 |
1480 | 33 | 32 | +1 |
1470 | 33 | 32 | +1 |
1460 | 33 | 32 | +1 |
1450 | 33 | 32 | +1 |
1440 | 32 | 31 | +1 |
1430 | 32 | 31 | +1 |
1420 | 32 | 31 | +1 |
1410 | 31 | 30 | +1 |
1400 | 31 | 30 | +1 |
1390 | 31 | 30 | +1 |
1380 | 30 | 29 | +1 |
1370 | 30 | 29 | +1 |
1360 | 30 | 29 | +1 |
1350 | 29 | 29 | 0 |
1340 | 29 | 28 | +1 |
1330 | 29 | 28 | +1 |
1320 | 28 | 28 | 0 |
1310 | 28 | 28 | 0 |
1300 | 28 | 27 | +1 |
1290 | 27 | 27 | 0 |
1280 | 27 | 27 | 0 |
1270 | 27 | 26 | +1 |
1260 | 27 | 26 | +1 |
1250 | 26 | 26 | 0 |
1240 | 26 | 26 | 0 |
1230 | 26 | 25 | +1 |
1220 | 25 | 25 | 0 |
1210 | 25 | 25 | 0 |
1200 | 25 | 25 | 0 |
1190 | 24 | 24 | 0 |
1180 | 24 | 24 | 0 |
1170 | 24 | 24 | 0 |
1160 | 24 | 24 | 0 |
1150 | 23 | 23 | 0 |
1140 | 23 | 23 | 0 |
1130 | 23 | 23 | 0 |
1120 | 22 | 22 | 0 |
1110 | 22 | 22 | 0 |
1100 | 22 | 22 | 0 |
1090 | 21 | 21 | 0 |
1080 | 21 | 21 | 0 |
1070 | 21 | 21 | 0 |
1060 | 21 | 21 | 0 |
1050 | 20 | 20 | 0 |
1040 | 20 | 20 | 0 |
1030 | 20 | 20 | 0 |
1020 | 19 | 20 | -1 |
1010 | 19 | 19 | 0 |
1000 | 19 | 19 | 0 |
990 | 19 | 19 | 0 |
980 | 18 | 19 | -1 |
970 | 18 | 18 | 0 |
960 | 18 | 18 | 0 |
950 | 17 | 18 | -1 |
940 | 17 | 18 | -1 |
930 | 17 | 17 | 0 |
920 | 17 | 17 | 0 |
910 | 16 | 17 | -1 |
900 | 16 | 17 | -1 |
890 | 16 | 16 | 0 |
880 | 16 | 16 | 0 |
870 | 15 | 16 | -1 |
860 | 15 | 16 | -1 |
850 | 15 | 15 | 0 |
840 | 15 | 15 | 0 |
830 | 15 | 15 | 0 |
820 | 14 | 15 | -1 |
810 | 14 | 15 | -1 |
800 | 14 | 14 | 0 |
790 | 14 | 14 | 0 |
780 | 14 | 14 | 0 |
770 | 13 | 14 | -1 |
760 | 13 | 14 | -1 |
750 | 13 | 13 | 0 |
740 | 13 | 13 | 0 |
730 | 13 | 13 | 0 |
720 | 12 | 13 | -1 |
710 | 12 | 12 | 0 |
700 | 12 | 12 | 0 |
690 | 12 | 12 | 0 |
680 | 11 | 12 | -1 |
670 | 11 | 12 | -1 |
660 | 11 | 12 | -1 |
650 | 11 | 12 | -1 |
640 | 10 | 12 | -2 |
630 | 10 | 12 | -2 |
620 | 10 | 11 | -1 |
610 | 9 | 11 | -2 |
600 | 9 | 11 | -2 |
590 | 9 | 11 | -2 |
Click to view detailed tables for the exact concordance values at your ACT score.
ACT to SAT – How Things Changed
If you took the ACT, find your score in the first column. The second column is your converted SAT score with the new concordance; the third is your converted SAT score with the old, 2016 concordance. The change in SAT points from old to new concordance is listed in the final column. Scorers at the ends of the range tended to be more affected by the new concordance than those in the middle.
ACT | SAT (2018) | SAT (2016) | Change |
---|---|---|---|
36 | 1590 | 1600 | -10 |
35 | 1540 | 1570 | -30 |
34 | 1500 | 1540 | -40 |
33 | 1460 | 1500 | -40 |
32 | 1430 | 1470 | -40 |
31 | 1400 | 1430 | -30 |
30 | 1370 | 1400 | -30 |
29 | 1340 | 1360 | -20 |
28 | 1310 | 1320 | -10 |
27 | 1280 | 1290 | -10 |
26 | 1240 | 1260 | -20 |
25 | 1210 | 1220 | -10 |
24 | 1180 | 1180 | 0 |
23 | 1140 | 1140 | 0 |
22 | 1110 | 1110 | 0 |
21 | 1080 | 1070 | +10 |
20 | 1040 | 1030 | +10 |
19 | 1010 | 990 | +20 |
18 | 970 | 950 | +20 |
17 | 930 | 910 | +20 |
16 | 890 | 870 | +20 |
15 | 850 | 830 | +20 |
14 | 800 | 780 | +20 |
13 | 760 | 740 | +20 |
12 | 710 | 680 | +30 |
11 | 670 | 590 | +80 |
10 | 630 | - | - |
9 | 590 | - | - |
Compare Your Scores
While a concordance table can tell you what your SAT score maps to on the ACT, it does not indicate whether your SAT scores are significantly stronger than your ACT scores. For that insight, you can use our comparison tool or graph below. The graph and tables are also available as a handy PDF download.
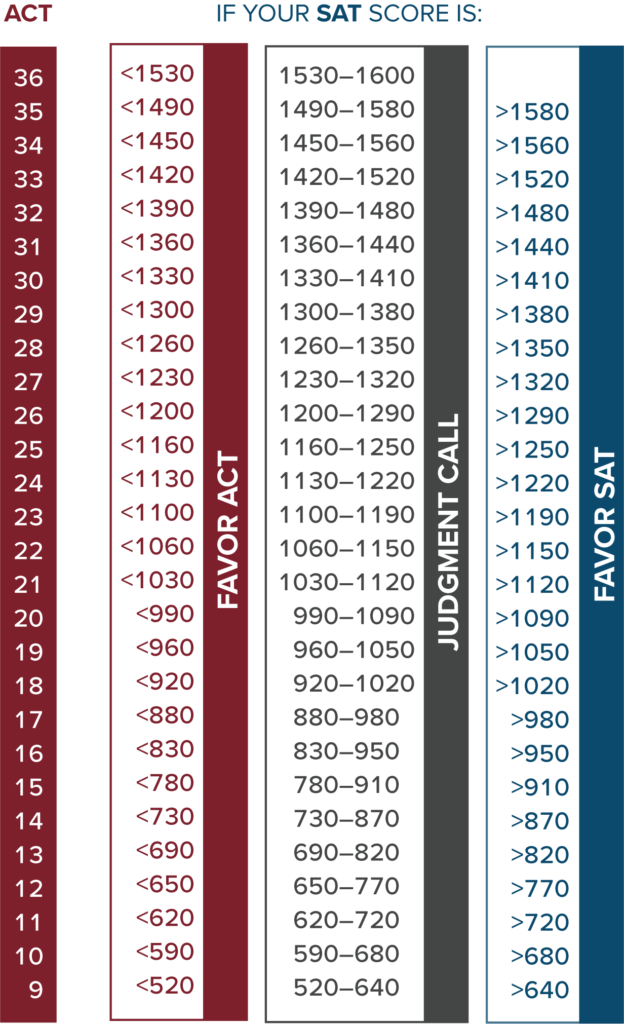
The analysis provided in the widget above is also available in graph and table form below (or access the PDF for easy distribution). Many students will find that their scores intersect somewhere in the “Judgment Call” band, but some may discover that one test is better suited to their strengths.
Download a PDF of This Resource
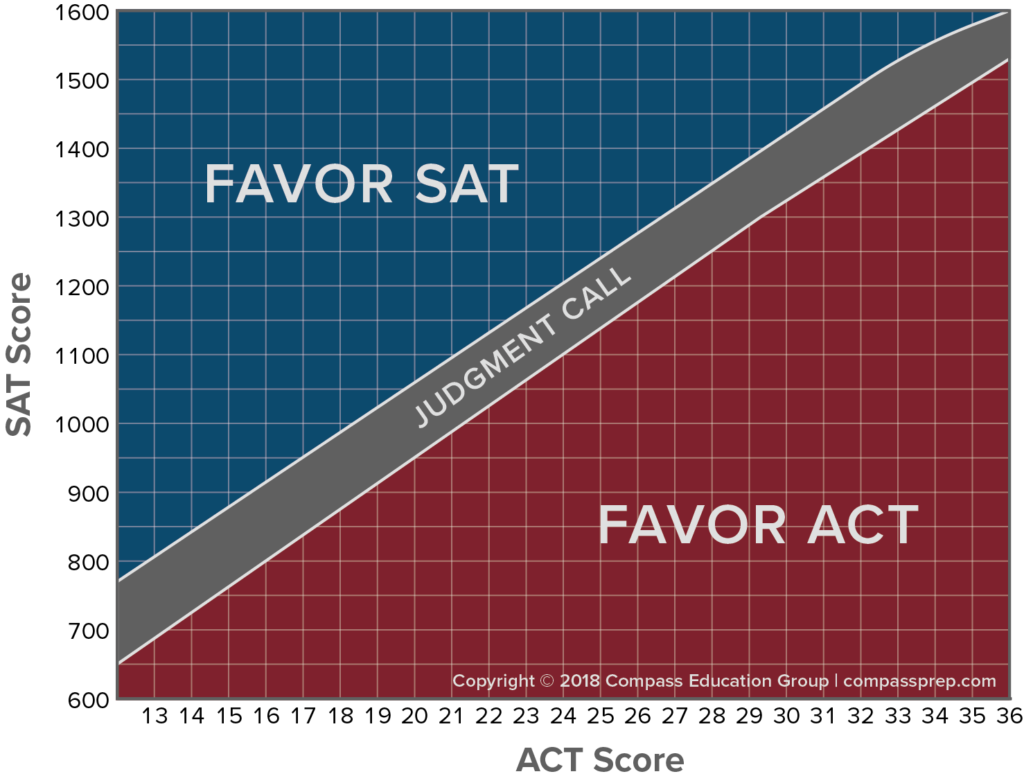
To use the tables below, find the row with your ACT score in the left column and track right to find the column with your SAT score. This will help you determine whether your scores favor the ACT, SAT, or are so close that you should make a judgment call based on additional information.
Concordance Tables
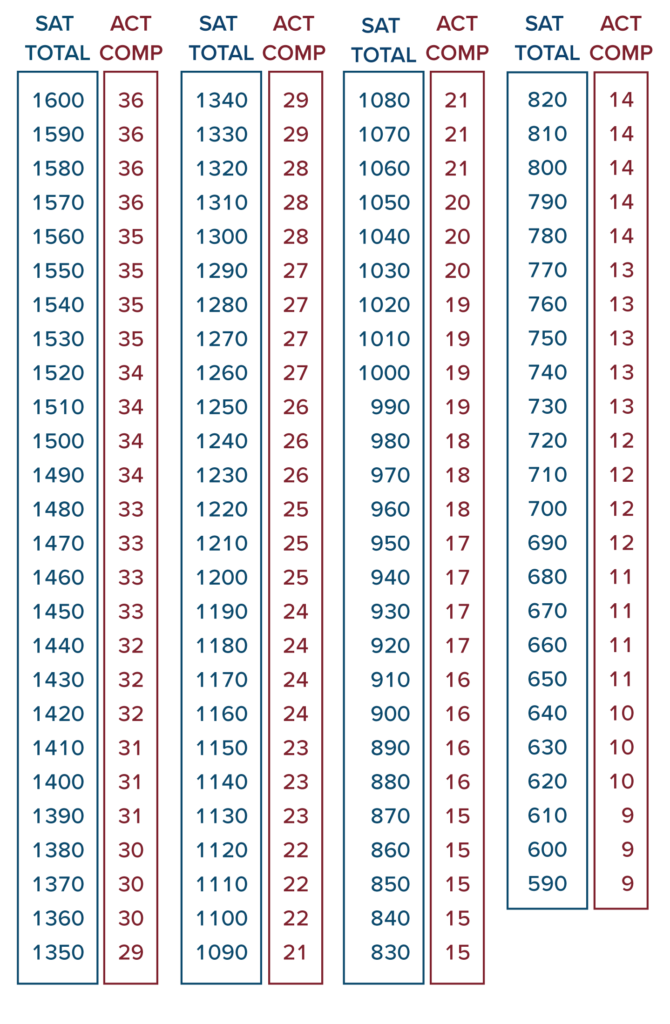
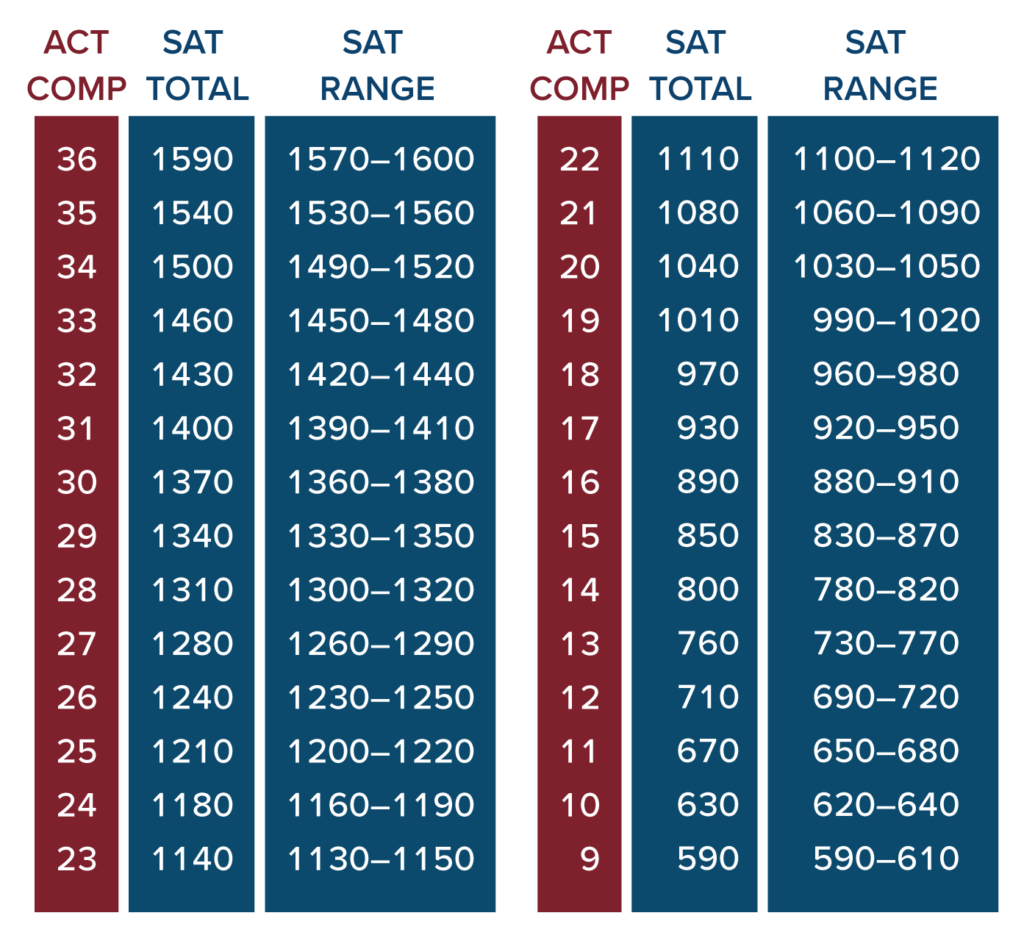
And finally, no set of resources would be complete without the concordance tables from College Board and ACT. In order to see how SAT and ACT scores compare, we have provided the two Total to Composite concordance tables. If you have an SAT score, you can use the first table below to find comparable scores on the ACT. If you have taken the ACT, the second table gives you a score-by-score comparison with the SAT. These tables are also useful when looking at college, scholarship, or NCAA eligibility information.
SAT to ACT
ACT to SAT
College Board and ACT have provided SAT Math to ACT Math concordance tables and SAT Evidence-Based Reading and Writing to ACT English + Reading (note that the latter is on a 72 point scale instead of 36). To access these tables, please download the PDF of the Compass comparison resource.