
This post reflects the specifics for the class of 2018 cutoffs as published in September 2017. For continually updated estimates of future years, please see the National Merit Semifinalist Cutoffs post.
The National Merit Semifinalist cutoffs for the class of 2018 are now final, and they confirm Compass’ analysis that there would be widescale increases. Forty-six states saw higher cutoffs versus the class of 2017 figures. Only Rhode Island saw a decrease in its NMSF cutoff. Most of the large moves came in states with low student populations or with lower than average cutoffs. Michigan was the largest state to see a significant move, going from a 216 cutoff to 219. The state recently moved from state-funded ACT testing to state-funded SAT testing.
| State | Class of 2018 | Class of 2017 | Change | Class of 2016 Semifinalists |
|---|---|---|---|---|
| Alabama | 216 | 215 | 1 | 234 |
| Alaska | 217 | 213 | 4 | 43 |
| Arizona | 220 | 219 | 1 | 294 |
| Arkansas | 215 | 213 | 2 | 143 |
| California | 222 | 221 | 1 | 2,102 |
| Colorado | 220 | 218 | 2 | 253 |
| Connecticut | 221 | 220 | 1 | 180 |
| Delaware | 221 | 218 | 3 | 43 |
| District of Columbia | 223 | 222 | 1 | 44 |
| Florida | 219 | 217 | 2 | 807 |
| Georgia | 220 | 219 | 1 | 455 |
| Hawaii | 220 | 217 | 3 | 66 |
| Idaho | 216 | 214 | 2 | 92 |
| Illinois | 221 | 219 | 2 | 758 |
| Indiana | 219 | 217 | 2 | 337 |
| Iowa | 216 | 215 | 1 | 167 |
| Kansas | 219 | 217 | 2 | 155 |
| Kentucky | 217 | 215 | 2 | 225 |
| Louisiana | 216 | 214 | 2 | 212 |
| Maine | 215 | 214 | 1 | 76 |
| Maryland | 222 | 221 | 1 | 307 |
| Massachusetts | 222 | 222 | 0 | 345 |
| Michigan | 219 | 216 | 3 | 543 |
| Minnesota | 220 | 219 | 1 | 304 |
| Mississippi | 213 | 212 | 1 | 128 |
| Missouri | 217 | 216 | 1 | 349 |
| Montana | 214 | 210 | 4 | 52 |
| Nebraska | 215 | 215 | 0 | 97 |
| Nevada | 217 | 214 | 3 | 104 |
| New Hampshire | 217 | 216 | 1 | 75 |
| New Jersey | 223 | 222 | 1 | 512 |
| New Mexico | 215 | 213 | 2 | 91 |
| New York | 221 | 219 | 2 | 961 |
| North Carolina | 219 | 218 | 1 | 436 |
| North Dakota | 211 | 209 | 2 | 20 |
| Ohio | 219 | 217 | 2 | 603 |
| Oklahoma | 216 | 213 | 3 | 187 |
| Oregon | 220 | 219 | 1 | 177 |
| Pennsylvania | 219 | 218 | 1 | 699 |
| Rhode Island | 216 | 217 | -1 | 55 |
| South Carolina | 217 | 215 | 2 | 201 |
| South Dakota | 215 | 209 | 6 | 44 |
| Tennessee | 218 | 218 | 0 | 335 |
| Texas | 221 | 220 | 1 | 1,308 |
| Utah | 216 | 215 | 1 | 156 |
| Vermont | 217 | 215 | 2 | 35 |
| Virginia | 222 | 221 | 1 | 381 |
| Washington | 222 | 220 | 2 | 345 |
| West Virginia | 211 | 209 | 2 | 79 |
| Wisconsin | 217 | 215 | 2 | 323 |
| Wyoming | 213 | 209 | 4 | 24 |
| U.S. Citizens Studying Abroad | 223 | 222 | 1 | 120 |
| U.S. Territories | 211 | 209 | 2 | 140 |
| Commended Student | 211 | 209 | 2 | 39,765 |
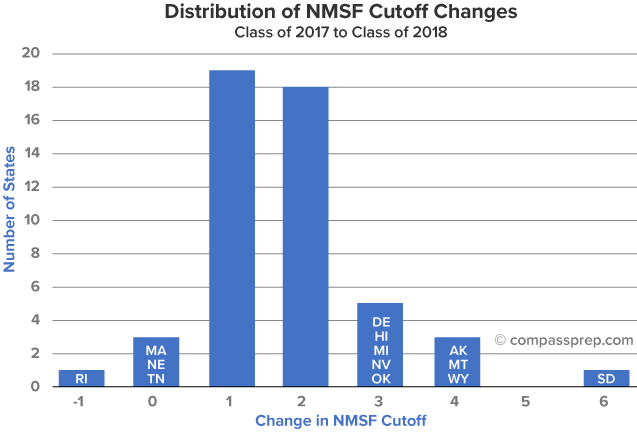 States with lower populations – and lower numbers of Semifinalists – can have more volatile cutoffs. The average change for states with fewer than 100 Semifinalists per year was 2.5 points. States with more than 400 Semifinalists per year saw an average increase of 1.5 points. [Counts are given for the class of 2016, the most recently available figures.] An even larger difference is seen when comparing states at the two extremes of the cutoff range. The 10 states with the lowest cutoffs (209-213) for the class of 2017 saw an average increase of 3 points. The 8 states with the highest 2017 cutoffs (220-222) saw only about a 1 point change. This difference can be seen graphically when the 2017 cutoffs are plotted against the 2018 cutoffs.
 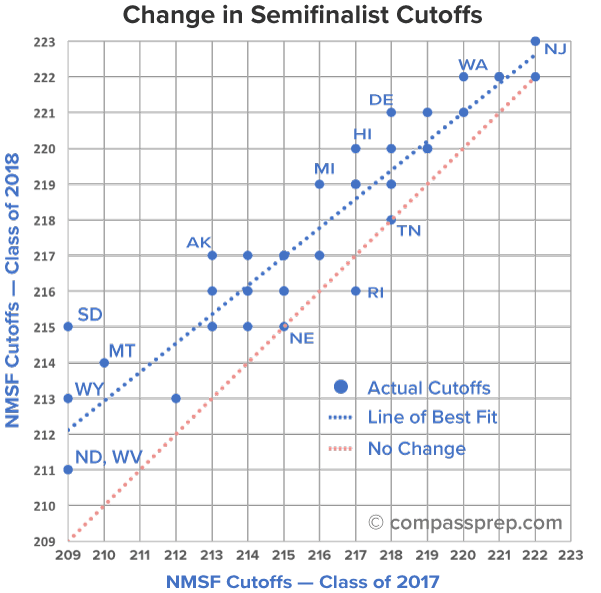 Had no cutoffs changed, all of the states would have fallen along the dotted red line. Instead, a best-fit line (blue) reflects the increases. The gap between the lines narrows from bottom to top. When looked at from this vantage point, Delaware’s 3-point change is almost as significant as South Dakota’s 6-point swing. A change does not mean a trend. A trend does not mean that movement only occurs in one direction. For this reason, Compass advises future classes to think of cutoffs in terms of estimated ranges. This page reflects the actual results for the class of 2018. For estimates on future classes, please see our National Merit Semifinalist Cutoffs page or our other current blog posts on National Merit. Expand the sections below for answers to common questions about the Semifinalist cutoffs and the PSAT/NMSQT.
Why are score changes so much smaller at the high end?
Even in this “up year,” only New Jersey saw a cutoff of 223 (cutoffs for DC and U.S. students studying abroad are based on the highest scoring state). Several more states were bunched up at 222. These results lend credence to the theory that cutoffs on the redesigned PSAT reach a natural limit. A “lopsided” student has a much harder time of reaching a top SI. On the old PSAT, a strong math student might score a 720 CR, 800 M, and 720 W and reach an SI of 224. A top-notch verbal student could have a mediocre Math score and still reach 224 (800 CR, 640 M, 800 M). On the new PSAT, a perfect scoring EBRW student must now pair that performance with an excellent Math score to reach the same level (760 EBRW and 720 M). While it is possible that a state might eventually hit a 224 Semifinalist cutoff, we think it is unlikely. Unless the test undergoes dramatic changes, we believe that it is impossible for a cutoff to ever reach 225. Cutoffs increased for the class of 2017 and have now increased again. Will they keep going up? In both cases, the College Board played a larger role than did test-takers in overall score changes. There is not yet evidence that scores are on the rise for future years. In fact, we think it is the least likely case – although not by a large margin – when choosing among “no change,” “lower scores,” and “higher scores.” Nationally, the ability levels of the top 16,200 students among 1.5 million NMSQT participants is relatively static over any mid-term window. The change for the class of 2017 was as expected as it was dramatic. The PSAT underwent a complete overhaul. The elimination of the guessing penalty and the reduction in multiple-choice answers helped “inflate” most scores. The shift from 200-800 scoring per section to 160-760 per section slightly lowered the top end.
What, then, caused scores to rise for the class of 2018?
There have been a number of theories to explain the increase in PSAT scores for the class of 2018. Test-takers for the 2016 PSAT had the advantage of additional practice materials, improved test preparation, and increased familiarity (many took the redesigned PSAT as sophomores in 2015). While any or all of these factors may have had some impact, Compass’ research points to PSAT scaling imperfections or irregularities as the more likely cause. College Board’s goal is to make sure that PSAT scores from one year are comparable to PSAT scores in another year. It has not always met that goal. It faced a more difficult task than usual for the October 2015 and 2016 PSATs, because the scales were in flux and several PSAT problems had to be discarded as invalid. The fact that 46 of 50 states saw increased cutoffs and that PSAT scores increased for sophomore and juniors at essentially all ability levels means that student-specific factors such as increased preparation do not adequately explain the changes. The rise in cutoffs does not reflect an inexorable increase in scores. While cutoffs fluctuate from year-to-year, a longer view shows that there has not been a national trend toward higher scores. That claim cannot be made as universally at the state level. In-migration and economic growth help fuel competition for Semifinalist slots, which is why a state such as Texas has seen an upward trend over the last decade. Michigan is an example of where heightened attention to the PSAT can raise scores quickly. Even at the state level, though, it is unwise to focus on year-over-year changes as an indicator of future results.
Have scores changed like this in the past?
There is relatively recent precedent for the sort of changes seen for the class of 2018. The class of 2012 had a 2-point increase in the Commended Student cutoff, just as happened this year. Only one state (Alaska) saw a lower cutoff, just as this year only one state (Rhode Island) saw a lower cutoff. Perhaps the most important takeaway, though, was that 2012 was an anomaly. It did not represent a shift in test performance but a one-year blip caused by imperfect scaling. The next year, the cutoffs fell, and they have since bounced around within expected ranges.
Does this mean cutoffs will fall back for the class of 2019?
Now that October 2017 score results are in, we have new analysis on our National Merit Semifinalist Cutoffs page.
Why do states have such different cutoffs?
Cutoffs vary across the country because the approximately 16,200 Semifinalists are allocated proportionally to states based on the total number of juniors in a class. The table at the top of the page shows how many Semifinalists from the class of 2016 were recognized in each state. A state’s cutoff is derived by finding the score that will produce, as closely as possible, the targeted number of Semifinalists. Students in any given state are competing only against fellow residents. The test is national, the competition is local.
Why do some states see such large changes?
Most teachers and counselors can point to a class of students that just seemed to have more award winners, more college admittances, or more star writers or athletes. Each year we see schools that make giant leaps from 20 Semifinalists to 35 (or the reverse). The smallest states have between 20 and 80 Semifinalists annually. Virginia’s magnet Thomas Jefferson High School for Science and Technology had more Semifinalists in the class of 2018 (145) than 18 states and more than the smallest 4 states combined. A “special class” can easily shift a small state’s cutoff. Also, there is no such thing as a 220.427 cutoff – it must be all or nothing at 220 or 221. This means that even larger states can see swings based only on small chance effects.
Is it just my imagination or do PSAT scores bounce around more than SAT scores?
It is not your imagination. While approximately the same number of students take the PSAT each year as take the SAT, there are crucial differences. Every student takes one of two PSAT/NMSQT forms on one of two dates in October (technically, there is a third, “alternate,” form and date). SATs have more dates, more forms, and students take and retake them throughout the year. The relative homogeneity of the PSAT means that it is highly susceptible to shifts, as there is no averaging out of differences. The size and direction of these shifts, though, cannot be predicted in advance. If they could be, College Board would take steps to prevent them.
Semifinalists — or prospective Semifinalists — may want to visit the Compass National Merit FAQ to understand more about the National Merit Scholarship Program and the steps along the way.

Appreciate all the info on US National Merit Scholars but where can I find out more about those living abroad who were also selected. I have a grandson living in London who has been named a 2018 National Merit Scholar.
Jean,
National Merit only releases full lists to school counselors and to the local press. I have never seen a published list of overseas students. Congratulations to your grandson!