[Part 3: Lowered Benchmark is the third of a three part report on the new PSAT. See Overview, Part 1: Percentile Inflation, and Part 2: Score Discrepancies. The entire report can also be downloaded or distributed as a PDF.]
Part 3: Lowered Benchmark
The dramatic lowering of the college and career readiness benchmark for the “verbal” portion of the PSAT and SAT calls for a deeper examination and reveals potential structural problems with the new exam.
College Board Sets an English Language Arts (ELA) Bar on the PSAT and SAT Far Below Comparable Standards
Despite its presumptive importance in college admission, the SAT has had a harder time establishing a wider role in K-12 education. Although revisions in 1994 and 2005 were meant, in part, to bring the SAT into closer alignment with academic standards, the exam still carried the residual suspicion that it only tested “test-taking skills,” was susceptible to short-term preparation, and was out-of-sync with education trends. Early on, ACT staked out a strong position in defining college readiness and in aligning test content with academic standards. The ACT surpassed the SAT in student volume by appealing to states and school districts to widen college access by offering testing to all students. As College Board plays catch-up — it only introduced its “SAT College Readiness Benchmark” in 2011 — ACT still brags about its historical advantage: “In ACT Aspire and the ACT, ACT has the only longitudinal college and career readiness assessments with scores linked to actual student performance in college courses and to descriptions of what students need to know and be able to do in college. No other organization can make this claim.” The redesigned SAT will need several years before it can make the same longitudinal and linking claims.
By the time David Coleman was hired in 2012 to lead College Board, it was clear that the organization was willing to prepare for the future even if it meant discarding much of what had come before. Coleman had been one of the architects of the Common Core standards for English Language Arts and was passionate about the SAT’s ability to be at the forefront of ensuring college and career readiness for all students.
An analysis of the new math and ELA college and career readiness benchmarks shows that while SAT Math standards were left largely untouched, the ELA benchmarks were lowered significantly. Below we explore five points that are at turns surprising, interesting, and troubling.
- College and career readiness ELA benchmarks on the PSAT and SAT have been lowered.
- The definition of “meets expectations” has changed.
- The “meets expectations” rate for the new ELA benchmarks is far above those of comparable exams.
- “Score pollution” at the low end of the EBRW scale impacts the validity of the 10th grade benchmark.
- No research has been published explaining how and why the ELA benchmarks were lowered or if any watering down occurred.
College Board had long left benchmarking to ACT. As the showdown between the companies moved more and more to state legislatures and departments of education, though, College Board decided to introduce a college and career readiness benchmark. A 1550 SAT was set in 2011 as the key benchmark, and section scores of 500 were set as benchmarks for Critical Reading, Writing, and Math [the composite score was higher than the sum of the individual sections]. PSAT score benchmarks were also developed to reflect progress toward those goals.
Revisions to the benchmarks were published along with the results of the new PSAT/NMSQT. Evidenced-Based Reading and Writing scores on the redesigned exam are nominally higher than the Critical Reading and Writing scores from the old PSAT, so it is surprising to see that the benchmarks were set lower on the new exam. A lot lower. Before comparing the new and old benchmarks, the old scores should first be concorded to new scores. When using a concordance, we cannot say that the new and old scores are completely interchangeable, but we can say that they represent comparable levels of performance — precisely what we want in the case of benchmarks.
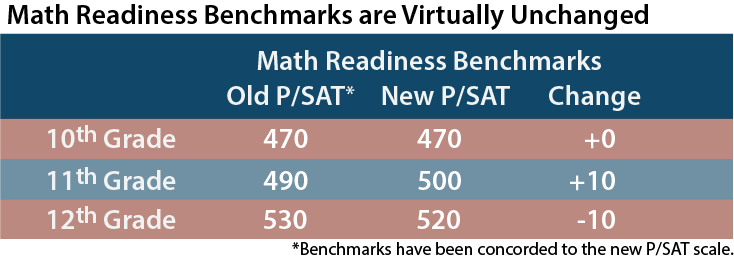
It appears that the readiness benchmark for math has made it to the new PSAT and SAT with little change. The old SAT and new SAT are entirely different exams, so scores must be compared through a concordance that matches comparable levels of performance. When old and new Math scores are concorded, the benchmark differences are minimal.
In contrast to the continuity of the math benchmarks, the ELA benchmarks have been reset far lower than before. In the chart below, the old and new benchmarks are compared after setting them both on the scale of the redesigned P/SAT.
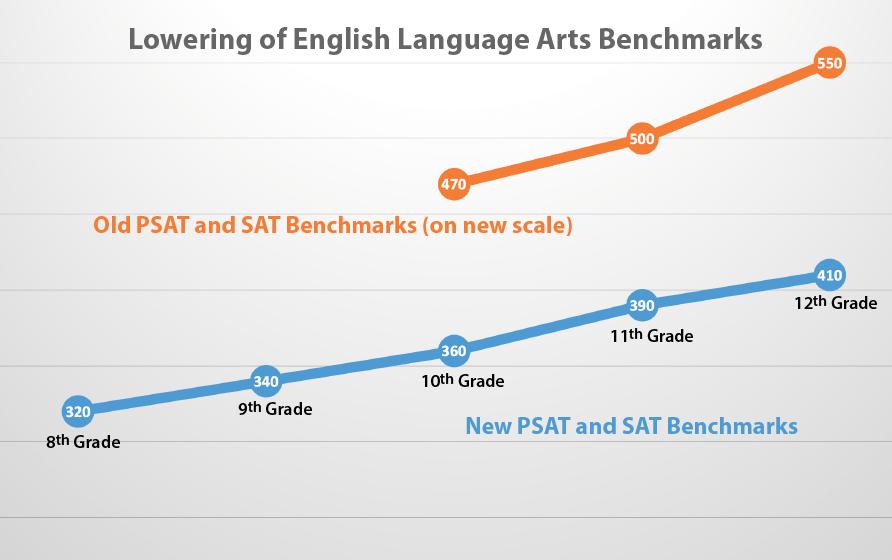
Among the takeaways on the new EBRW benchmark compared to the old Critical Reading and Writing benchmark:
- ELA benchmarks have been reduced by at least 110 points.
- The new mark is more than a standard deviation away from the old mark.
- Almost half (49%) of National Representative sophomores would miss the old benchmark. Only 10% of National Representative sophomores miss the new benchmark.
- The new 12th grade benchmark is 60 points lower than the previous 10th grade benchmark.
It is hard to grasp the extent of this change in an area so vital to college and career readiness. It makes little sense when attempting to bring more rigor to an admission test to lower the standards this much without strong reason. Soon before he assumed his duties as College Board president, David Coleman said, “The engine of social justice at the College Board is the presumption that more rigor draws students to a higher level. It would be the utmost betrayal of it to water that down.”
Changing Benchmark Definitions
For the new PSAT and SAT, College Board changed how it would define college and career readiness standards. Although such standards are almost universally referred to by testing organizations as “college and career readiness,” the benchmarks are usually defined by college success alone. Below is a comparison of College Board’s old and new benchmark definitions.
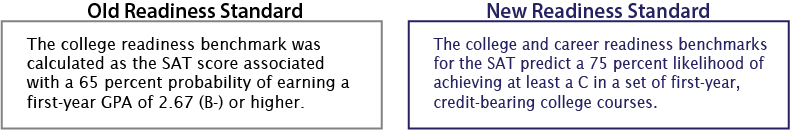
The GPA cut-off has been dropped from 2.67 to 2.00, while the probability for success has been moved from 67% to 75%. However, the definitional change does not lead directly to the lower benchmark scores. In fact, the change brings College Board’s definition more in line with those used by ACT and by Partnership for Assessment of Readiness for College and Careers (PARCC), two important competitors in readiness assessments. A key difference is that ACT adds a piece to the equation: “a 50% chance of obtaining a B or higher or about a 75% chance of obtaining a C or higher [emphasis added].” ACT and College Board also have differing interpretations of the college courses included in calculating first-year GPA.
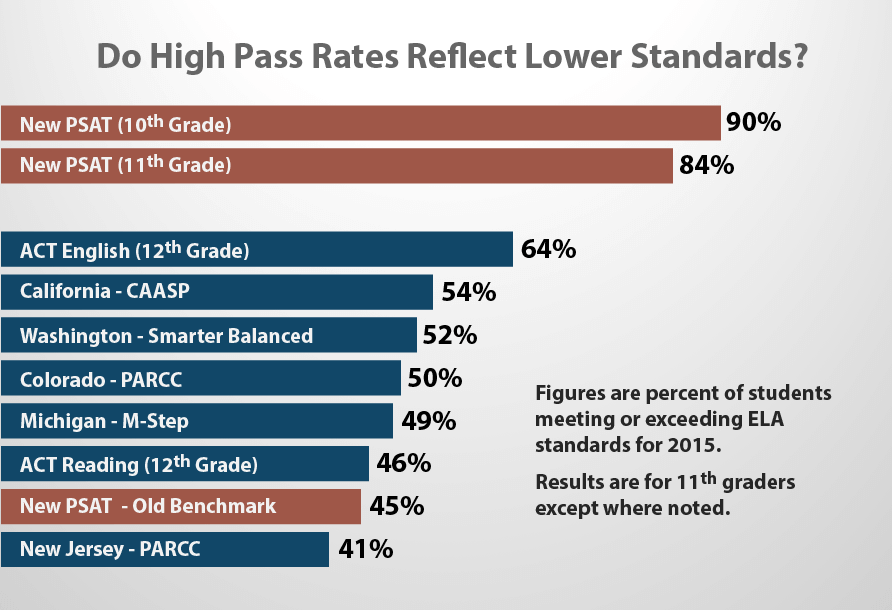
ACT’s ELA benchmarks are 18 for English and 22 for Reading. Due to content differences between the tests, these scores cannot be directly translated into SAT values. We can, though, look at performance against the benchmarks. Of graduating seniors in 2015 who took the ACT, 64% reached the English standard and 46% met or exceeded the Reading standard. This compares with 84-90% of PSAT/NMSQT Nationally Representative students meeting the grade-appropriate benchmarks. The figures become 85-92% if the User sample is considered. The “meets expectations” rate for the PSAT is almost double that of its previous standard and well above the rates in a basket of other ELA assessments.
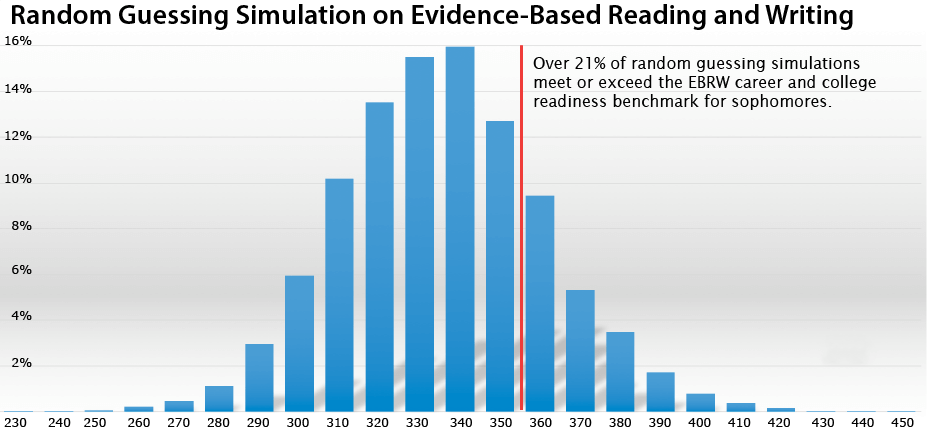
An additional problem with the low benchmarks set on the PSAT — especially for sophomores — is that the standards start bumping into the limitations of the test’s construction. Since the scale of the new PSAT is 160 to 760, it would appear that even a score of 360 (the sophomore benchmark) is 200 points above the bottom of the scale. The effective bottom of the scale, though, is closer to 300-320. A key feature of the new PSAT is the elimination of a “guessing penalty.” Every student should answer every question, because no points are deducted for incorrect answers. Given that there are only 4 answer choices per question, a random guesser would get 25% of questions right over the long term. This “tailwind effect” takes many scaled scores out of play. A simulation of 10,000 students randomly guessing on every Reading and Writing question on the released PSATs from October 14, 2015 and October 28, 2015 found that the average score for those random guessers would be 335; 50% of students would get 340 or higher. In fact, 21% of random guessers would meet the sophomore college and career readiness benchmark! It is hard to understand how an important learning benchmark can be reached by 21% of students doing nothing but bubbling random patterns on their answer sheets. If the benchmark really should be that low, then the test is not well designed to measure the cut-off. The noise from random guessing creates a type of score pollution.
It is difficult to reconcile the EBRW benchmarks with one of the prime goals stated in the founding document for the redesigned SAT: “[T]he test must better reflect, through its questions and tasks, the kinds of meaningful, engaging, rigorous work that students must undertake in the best high school courses being taught today, thereby creating a robust and durable bond between assessment and instruction.” To date, no research reports have been published on how the new benchmarks were set. College Board’s most recent publication on readiness, Research Foundations: Empirical Foundations for College and Career Readiness, does not yet deal with scores for the redesigned SAT and includes only descriptive statistics about college attainment. Did what is expected of students change so much so quickly that 90% of them will now meet expectations when only half as many met them last year? Were the previous expectations wrong? Do the new expectations better measure and expand opportunity? Will students respond positively — or at all — to the many different benchmarks provided? These are the types of questions that should be addressed.
Accountability and Transparency
While College Board long ago outgrew its official name — College Entrance Examination Board — the PSAT and SAT are still in transition from an earlier time. The public thinks of the PSAT and SAT primarily as college admission tests, but the exams are being tasked with an increasing number of duties — assessment, alignment, benchmarking, merit scholarships, gatekeeping, and placement. — for an increasing number of students and educators. States such as Connecticut, Michigan, Illinois, and Colorado have recently made multimillion dollar commitments to the SAT because of the promise of the redesign. Later this year, thousands of colleges will start receiving the new scores and slotting them into millions of applicant files (along with ACT scores). There is no slow build in standardized testing — change happens all at once. The inevitability of the new test, though, does not mean that attention should be limited to operational aspects. The rapid rise in public funding for the PSAT and SAT and the increasing number of tasks for which the exams claim competency require an increased level of scrutiny, accountability, and transparency.
Compass Education Group’s three part series on the PSAT is meant to illustrate several of the ways in which the new test must find its bearings. That is not to say that percentile inflation or the rise of the sharp-witted sophomore or even the resetting of the ELA benchmarks is the most fundamental question around the new PSAT or SAT. There are many questions and challenges to be faced. Implementing an entirely new college admission exam is a Herculean undertaking, and College Board set ambitious delivery goals for both validity and rollout. We hope that the efforts to meet deadlines have not pushed aside the original impetus for the redesign. Trust in the new exam should not come from the fact that its name reuses three letters; students deserve an SAT that judges fairly and openly.
[Part 3: Lowered Benchmark is the third of a three part report on the new PSAT. See Overview, Part 1: Percentile Inflation, and Part 2: Score Discrepancies. downloaded or distributed as a PDF]

One Comment