 What’s a good score? is the most commonly asked question when it comes to the digital PSAT and SAT. There are multiple ways of giving context to your score – percentiles, score ranges at popular colleges, skills analysis, and National Merit cutoffs.
A Perfect(ish) Score
Of course, a perfect score is a good score!
A perfect score on the PSAT is a 1520. If you’re in 10th grade and you score between 1420 and 1520, you’re in the top 1% of all test takers (99th percentile). If you’re in 11th grade, anything between a 1490 and 1520 places you in the top 1%. About 1.5 million students in each grade take the PSAT each year, so the 99th percentile puts you among the top 15,000 test takers.
A perfect score on the PSAT doesn’t necessarily mean that you’ll score that high on the SAT. The SAT is harder than the PSAT, which is why the PSAT tops out at 1520, while the SAT continues on to 1600. That perfect 1520 on the PSAT would place you in the top 3% of SAT testers. About 55,000 graduating seniors achieve that score or higher on the SAT.
Percentiles: Compare Yourself to Everyone
Your PSAT score report shows three percentiles: state, country, and all testers.
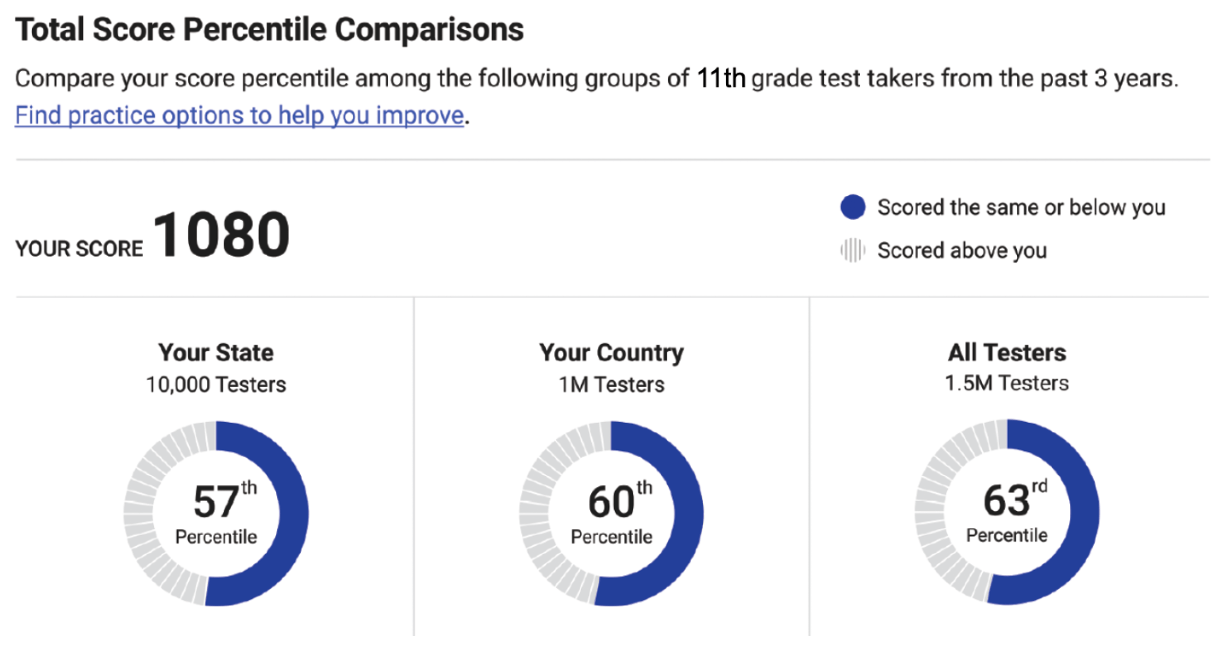
Percentiles are a way to compare your scores to the scores of other students. A percentile tells you the percent of students at your score or below. An 85th percentile score means that 85 students out of every 100 received your score or lower. This means that 15% of students scored higher. In the case of the digital PSAT, percentiles show where you stand when compared to the test takers in your grade from the past three years.
The percentile that really matters here is the All Testers percentile. This is the primary percentile that is shown on the front page of your report. You can see from the graphics what proportion of all students performed above you and what proportion of students scored the same or below you.
When thinking about how good your score is, it is also helpful to think about how good it can be. Most students improve with time, repeat testing, and preparation. How much you improve is up to you. We often talk about a reasonable goal being to cut the percent of students in front of you in half. So if you start in the 63rd percentile (37% of students higher than you), you’re aiming, with some preparation, to make it to the 82nd percentile (only 18% of students scoring higher than you). Read more about what scores you need to achieve to maintain and improve your percentiles.
Colleges: Compare Yourself to Admitted Students
Every year, colleges and universities release their Common Data Set. In this data, you’ll find the mid-50% range of scores of their entering class. This means that of all the students who (a) submitted scores and (b) accepted an offer of admission, the range of scores presented is the 25th percentile to the 75th percentile for the college. About a quarter of enrolling students score below that range, and about a quarter score above it.
You can compare your digital PSAT scores to the score ranges at schools by using Compass’s charts here.
Important Note: One of the effects of the pandemic on testing was that almost all colleges and universities implemented test optional policies. Two things happened: many more students applied to competitive colleges and students with lower scores were more likely to withhold scores than those who did better on the SAT.
The result? Score ranges are now inflated.
Schools are, in effect, only reporting on the scores of a self-selected group. Their student bodies and their admission standards may not have changed, but the reported score ranges did. For instance, take a look at the differences in a few schools between the data collected in 2019 and the most recent data to see the effects of test optional policies:
| School | 2019 | 2023 |
| Brown University | 1420–1560 | 1500–1560 |
| Harvard College | 1460–1580 | 1490–1580 |
| Emory University | 1350–1520 | 1450–1530 |
| Northwestern University | 1430–1550 | 1490–1550 |
| Occidental College | 1270–1450 | 1380–1490 |
| Stanford University | 1420–1570 | 1500–1570 |
When you’re comparing your PSAT scores to the ranges at colleges remember two things:
- Your scores will likely increase due to greater exposure to school content
- The current score ranges for colleges are inflated because many students who previously submitted scores in the lower 25% are no longer submitting scores.
A course of study, whether through one-on-one tutoring, small group classes, or highly motivated self-prep, can make a huge impact on the score you received on the PSAT and the score you’ll submit once you’ve taken your final SAT. Don’t count yourself out of testing just because your PSAT score may not be in the current mid-50% range of your target schools.
Content: Compare Your Scores to Where You Are
If you’ve just taken the PSAT, there’s a good chance that you simply haven’t covered all of the material in school that’s on the test. This is especially true for math. It may also be the case that you covered material on the test years ago and just need a refresh.
There are four content domains on the math test: Algebra, Advanced Math, Problem Solving & Data Analysis, and Trigonometry & Geometry. Your score report will show your relative strengths and weaknesses on these domains:
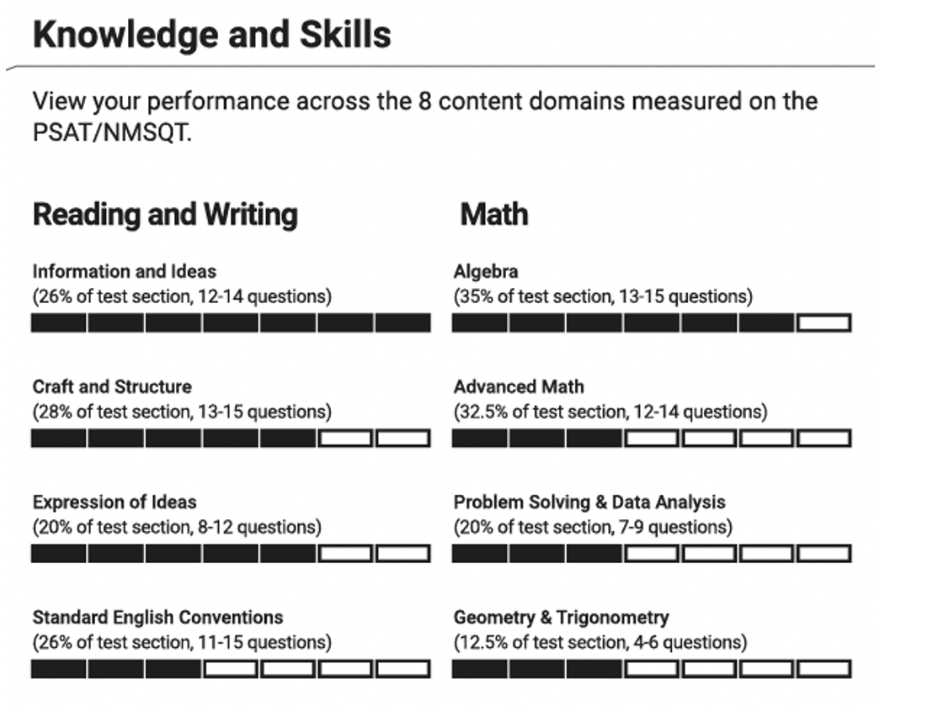 Think about how these domains map onto your current, prior, and upcoming math classes. A good PSAT math score is one that shows strengths in areas that you’ve already covered and weaknesses in areas that are yet to come.
Unfortunately, College Board no longer gives students access to the questions and answers from their PSAT, and the knowledge and skills bands are the most detail you’ll get on your performance. If you’re looking for more detailed analytics, including time per question, question type, and how similar scorers performed on your test, we encourage you to take a Compass practice test.
National Merit Scholarship Program
The PSAT/NMSQT is the entrance point for National Merit. If you have a great PSAT score as a junior, you will automatically be considered for National Merit honors and scholarships. About 50,000 students (approximately 3% of eligible students) will be named National Merit Commended Students, Semifinalists, Finalists, and Scholars. Compass has a full explanation of how the National Merit process works and what scores are likely needed to achieve National Merit honors.
