 This post still contains useful information about the development of our cutoff estimates, but it has been superseded by our more recent methodology.
National Merit cut-offs released in September 2015 are for the old SAT and provide little guidance for the New PSAT cut-offs to be announced in September 2016. Based on preliminary concordances released by College Board, current and previous score distribution figures, student data, and Compass modeling, we prepared estimated ranges of the new cut-offs for Semifinalists and Commended Students. You can also consult are National Merit FAQ. Below we discuss our methodology and some of the important obstacles in developing estimates.
Simulated Concordances
Compass ran simulations of the composition of old PSAT Selection Index values in order to find the concordant values on the New PSAT. Distribution plays an important role. The concordance results for a student with a 70CR, 70M, and 70W (210 Selection Index) on the old PSAT are different than for a student with a 60CR, 80M, 70W. The latter is mathematically possible, but is far less likely than the former, Our simulations weighted the “most likely” score combinations. The quirks in the scaling of the new test mean that while the states with the highest Selection Indexes will see lower cut-offs in for the class of 2017, other states will see higher cut-offs. In fact, our estimates show that the Commended Student cut-off could climb as high as 210, although we expect it to be closer to 207 [It ended up at 209.]
A Double-Check of the Concordance Route
Any method for estimating National Merit figures based on College Board data should contain a double-check or triple-check, because the released College Board tables are preliminary and may, in some situations, be inaccurate. One important double-check is to look at actual student results. For example, if School X always sees between 27 and 33 National Merit Semifinalists, then School X is a good predictor of its state’s cut-off. The changes made to the New PSAT are unlikely to significantly change the number of recognized students at School X. At what New PSAT score would School X have 33 National Merit Semifinalists? 27 Semifinalists? For California results, Compass has been able to perform this double-check, and this also gives us insight into adjacent scores. The same assumptions should not be made about a school that typically sees few Semifinalists or has fluctuating numbers.
Misleading Percentiles
Selection Index percentiles cannot be used to determine Semifinalist cut-offs. 1) Percentiles reflect the national pool of test-takers, whereas cut-offs are determined on a state-by-state basis 2) The reported percentiles on PSAT score reports are based on a small sample group that Compass has previously shown is not perfectly representative — especially at the all-important tail of the curve.
Concordances Do Not Link Selection Index
College Board has not provided a concordance of Old PSAT Selection Index to New PSAT Selection Index, nor does it need to. The released concordances focus on decisions colleges will need to make with SAT scores. PSAT selection indices do not come into play. This gap in concordances, though, means that a way of concording scores must be pieced together, and each piece introduces some level of error. For example. The new Reading and Writing and Language tests are each reported on 8-38 scales. This scale gives only 31 different scores as opposed to the 61 that existed on the 20-80 scale. In not-at-all-technical terms, this makes the concordances lumpy. Concordances are always subject to rounding, and are also dependent on the reference group used.
Distribution of Scores is Not Normal
Some students and organizations make the incorrect assumption that scores on the PSAT follow a normal distribution. The original SAT scale — which the old PSAT mimicked — was set as a normal distribution. It’s wrong to assume that the distribution of New PSAT scores will follow the same curve. In fact, we know that they do not. The PSAT and SAT are normed test — the scales are set not based on the current test takers but on a consistent reference group — but that is not the same things as saying that scores are normalized. The changes to the test do not necessarily shift subject scores in uniform ways, so we cannot know, for example, that students who got top Math and Writing scores on the old PSAT will get top Math and Writing and Language scores on the new PSAT. Our modeling shows that these shifts should be modest.
Score Distributions Vary Across Subjects
Scores were not equally common across Critical Reading, Math, and Writing, and they are not equally common across EBRW and Math. This difference is accentuated by the fact that the Selection Index weights the EBRW score double that of the Math score. Below is a simple example of several possible section scores that give the same total score of 1460 but produce very different Selection Index scores and very different results.
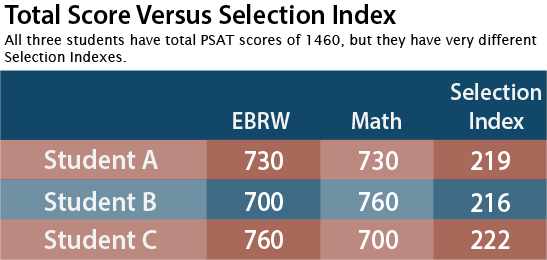
Student B almost certainly misses the Semifinalist cut in California. Student C almost certainly makes the cut. Student A is on the bubble.
Changes in Behavior
Population shifts usually have small year-to-year impact on the larger states, but some schools and students decided to skip the PSAT this year. There was also less test preparation done for the PSAT, since many students were already focused on the ultimate goal of a high ACT score.

I think you mean Student B almost certainly misses in CA with a score of 210. Wouldn’t Student A be the one on the bubble with 219?
The graphic was done after the post and reversed the students. Fixed. Thank you.
It certainly does. Changes slipped in between copy and graphics. Student B should be 700/760 with an SI of 216. Graphic will be updated shortly.
Doesn’t 670 + 760 = 1430?