
Below are the Semifinalist cutoffs for the 19 years from the class of 2008 to the class of 2026. Because of the change in PSAT scoring for the class of 2017, earlier cutoffs have been restated on the new scale and are flagged with an asterisk. See our Semifinalist cutoff post for a complete analysis of the current class and projections for the future.
| State | Class of 2008* | Class of 2009* | Class of 2010* | Class of 2011* | Class of 2012* | Class of 2013* | Class of 2014* | Class of 2015* | Class of 2016* | Class of 2017 | Class of 2018 | Class of 2019 | Class of 2020 | Class of 2021 | Class of 2022 | Class of 2023 | Class of 2024 | Class of 2025 | Class of 2026 |
|---|---|---|---|---|---|---|---|---|---|---|---|---|---|---|---|---|---|---|---|
| Alabama | 214 | 214 | 214 | 215 | 216 | 214 | 216 | 213 | 214 | 215 | 216 | 216 | 216 | 212 | 212 | 212 | 210 | 212 | 214 |
| Alaska | 217 | 216 | 216 | 217 | 216 | 211 | 216 | 215 | 212 | 213 | 217 | 215 | 213 | 212 | 208 | 210 | 209 | 214 | 215 |
| Arizona | 216 | 214 | 215 | 214 | 217 | 216 | 217 | 217 | 218 | 219 | 220 | 220 | 219 | 218 | 218 | 214 | 216 | 217 | 218 |
| Arkansas | 208 | 211 | 210 | 210 | 212 | 209 | 212 | 212 | 211 | 213 | 215 | 214 | 214 | 212 | 211 | 210 | 210 | 213 | 215 |
| California | 219 | 219 | 219 | 220 | 221 | 220 | 221 | 221 | 221 | 221 | 222 | 223 | 222 | 221 | 221 | 220 | 221 | 221 | 224 |
| Colorado | 217 | 217 | 217 | 216 | 218 | 216 | 218 | 217 | 218 | 218 | 220 | 221 | 220 | 217 | 217 | 217 | 216 | 218 | 219 |
| Connecticut | 219 | 219 | 219 | 220 | 220 | 219 | 221 | 220 | 220 | 220 | 221 | 222 | 221 | 220 | 220 | 221 | 221 | 221 | 223 |
| Delaware | 220 | 220 | 220 | 218 | 219 | 218 | 219 | 218 | 218 | 218 | 221 | 222 | 220 | 219 | 220 | 218 | 219 | 219 | 220 |
| Florida | 216 | 216 | 216 | 215 | 217 | 216 | 217 | 216 | 217 | 217 | 219 | 219 | 219 | 216 | 217 | 216 | 216 | 217 | 219 |
| Georgia | 217 | 218 | 217 | 218 | 219 | 217 | 219 | 218 | 219 | 219 | 220 | 220 | 220 | 219 | 219 | 218 | 217 | 218 | 220 |
| Hawaii | 217 | 218 | 217 | 218 | 218 | 216 | 218 | 217 | 217 | 217 | 220 | 220 | 219 | 217 | 217 | 215 | 217 | 217 | 219 |
| Idaho | 211 | 214 | 214 | 214 | 216 | 213 | 216 | 216 | 214 | 214 | 216 | 214 | 215 | 214 | 214 | 215 | 211 | 213 | 215 |
| Illinois | 217 | 217 | 217 | 217 | 218 | 217 | 218 | 218 | 218 | 219 | 221 | 221 | 221 | 219 | 218 | 219 | 219 | 220 | 222 |
| Indiana | 217 | 217 | 216 | 216 | 217 | 216 | 218 | 216 | 217 | 217 | 219 | 219 | 218 | 215 | 215 | 214 | 216 | 217 | 218 |
| Iowa | 214 | 215 | 214 | 214 | 215 | 213 | 215 | 213 | 214 | 215 | 216 | 216 | 215 | 212 | 211 | 212 | 210 | 212 | 214 |
| Kansas | 216 | 216 | 216 | 216 | 217 | 216 | 218 | 217 | 217 | 217 | 219 | 218 | 218 | 214 | 215 | 214 | 214 | 215 | 216 |
| Kentucky | 214 | 214 | 214 | 214 | 216 | 214 | 216 | 215 | 215 | 215 | 217 | 218 | 217 | 214 | 212 | 212 | 211 | 213 | 214 |
| Louisiana | 212 | 214 | 213 | 215 | 214 | 214 | 214 | 214 | 216 | 214 | 216 | 217 | 215 | 212 | 213 | 213 | 214 | 214 | 216 |
| Maine | 216 | 216 | 217 | 217 | 216 | 215 | 218 | 216 | 216 | 214 | 215 | 217 | 215 | 213 | 211 | 215 | 213 | 214 | 217 |
| Maryland | 221 | 220 | 221 | 220 | 221 | 220 | 221 | 221 | 221 | 221 | 222 | 223 | 222 | 221 | 224 | 222 | 221 | 222 | 224 |
| Massachusetts | 221 | 221 | 221 | 221 | 221 | 221 | 222 | 221 | 221 | 222 | 222 | 223 | 223 | 222 | 221 | 220 | 222 | 223 | 225 |
| Michigan | 214 | 214 | 214 | 214 | 215 | 213 | 215 | 215 | 215 | 216 | 219 | 219 | 219 | 216 | 217 | 218 | 217 | 218 | 220 |
| Minnesota | 217 | 217 | 218 | 217 | 218 | 217 | 218 | 218 | 217 | 219 | 220 | 220 | 219 | 218 | 218 | 216 | 216 | 217 | 219 |
| Mississippi | 209 | 208 | 210 | 212 | 212 | 211 | 213 | 213 | 214 | 212 | 213 | 215 | 214 | 211 | 213 | 210 | 209 | 212 | 213 |
| Missouri | 216 | 217 | 216 | 215 | 217 | 215 | 217 | 214 | 214 | 216 | 217 | 217 | 217 | 214 | 214 | 213 | 214 | 215 | 217 |
| Montana | 213 | 214 | 211 | 214 | 214 | 210 | 213 | 212 | 211 | 210 | 214 | 214 | 214 | 210 | 208 | 207 | 209 | 209 | 213 |
| Nebraska | 213 | 212 | 213 | 215 | 214 | 213 | 214 | 214 | 214 | 215 | 215 | 216 | 216 | 213 | 210 | 212 | 210 | 211 | 214 |
| Nevada | 214 | 212 | 209 | 214 | 214 | 214 | 216 | 214 | 216 | 214 | 217 | 218 | 218 | 215 | 214 | 210 | 211 | 214 | 214 |
| New Hampshire | 218 | 216 | 217 | 217 | 218 | 216 | 217 | 216 | 217 | 216 | 217 | 219 | 218 | 215 | 214 | 213 | 215 | 217 | 219 |
| New Jersey | 221 | 220 | 221 | 221 | 221 | 221 | 222 | 222 | 222 | 222 | 223 | 223 | 223 | 222 | 222 | 223 | 223 | 223 | 225 |
| New Mexico | 214 | 214 | 214 | 212 | 215 | 214 | 215 | 215 | 214 | 213 | 215 | 215 | 213 | 211 | 210 | 208 | 207 | 211 | 210 |
| New York | 220 | 218 | 219 | 219 | 220 | 218 | 220 | 219 | 220 | 219 | 221 | 221 | 221 | 220 | 220 | 219 | 220 | 220 | 223 |
| North Carolina | 217 | 218 | 217 | 217 | 219 | 217 | 218 | 216 | 218 | 218 | 219 | 220 | 219 | 217 | 218 | 217 | 217 | 218 | 220 |
| North Dakota | 209 | 208 | 209 | 209 | 211 | 207 | 211 | 208 | 209 | 209 | 211 | 212 | 212 | 209 | 207 | 209 | 207 | 210 | 210 |
| Ohio | 216 | 217 | 216 | 216 | 217 | 216 | 218 | 217 | 218 | 217 | 219 | 219 | 218 | 215 | 215 | 216 | 216 | 217 | 219 |
| Oklahoma | 213 | 214 | 213 | 212 | 214 | 212 | 215 | 212 | 214 | 213 | 216 | 215 | 214 | 211 | 210 | 211 | 208 | 211 | 212 |
| Oregon | 217 | 217 | 217 | 218 | 218 | 217 | 219 | 219 | 218 | 219 | 220 | 221 | 220 | 217 | 220 | 216 | 216 | 216 | 219 |
| Pennsylvania | 217 | 217 | 217 | 218 | 218 | 217 | 219 | 218 | 219 | 218 | 219 | 220 | 220 | 217 | 218 | 218 | 219 | 219 | 221 |
| Rhode Island | 216 | 217 | 219 | 216 | 217 | 216 | 218 | 216 | 216 | 217 | 216 | 220 | 218 | 216 | 213 | 216 | 215 | 217 | 219 |
| South Carolina | 215 | 216 | 216 | 214 | 216 | 214 | 215 | 214 | 216 | 215 | 217 | 216 | 215 | 212 | 213 | 213 | 209 | 214 | 215 |
| South Dakota | 210 | 212 | 212 | 212 | 212 | 211 | 212 | 210 | 209 | 209 | 215 | 215 | 214 | 209 | 210 | 212 | 209 | 208 | 211 |
| Tennessee | 217 | 217 | 217 | 216 | 217 | 215 | 216 | 216 | 216 | 218 | 218 | 219 | 219 | 215 | 215 | 215 | 217 | 217 | 219 |
| Texas | 218 | 218 | 218 | 218 | 220 | 218 | 220 | 219 | 220 | 220 | 221 | 221 | 221 | 219 | 220 | 219 | 219 | 219 | 222 |
| Utah | 209 | 210 | 212 | 210 | 214 | 212 | 214 | 214 | 212 | 215 | 216 | 215 | 215 | 212 | 212 | 211 | 209 | 211 | 213 |
| Vermont | 218 | 217 | 217 | 216 | 219 | 217 | 219 | 217 | 217 | 215 | 217 | 216 | 216 | 212 | 211 | 213 | 212 | 215 | 216 |
| Virginia | 219 | 220 | 219 | 219 | 220 | 219 | 221 | 220 | 221 | 221 | 222 | 222 | 222 | 221 | 221 | 221 | 219 | 222 | 224 |
| Washington | 218 | 219 | 219 | 219 | 220 | 218 | 220 | 220 | 220 | 220 | 222 | 222 | 221 | 220 | 220 | 220 | 220 | 222 | 224 |
| West Virginia | 207 | 210 | 210 | 209 | 211 | 207 | 210 | 208 | 209 | 209 | 211 | 212 | 212 | 209 | 207 | 207 | 207 | 209 | 210 |
| Wisconsin | 214 | 215 | 213 | 214 | 214 | 213 | 215 | 214 | 214 | 215 | 217 | 216 | 216 | 213 | 214 | 213 | 213 | 214 | 215 |
| Wyoming | 207 | 208 | 208 | 209 | 211 | 207 | 210 | 211 | 209 | 209 | 213 | 212 | 212 | 209 | 208 | 207 | 207 | 209 | 210 |
| District of Columbia | 221 | 221 | 221 | 221 | 221 | 221 | 222 | 222 | 222 | 222 | 223 | 223 | 223 | 222 | 224 | 223 | 223 | 223 | 225 |
| U.S. Territories | 207 | 208 | 208 | 209 | 211 | 207 | 210 | 208 | 209 | 209 | 211 | 212 | 212 | 209 | 207 | 207 | 207 | 208 | 210 |
| Studying Abroad | 221 | 221 | 221 | 221 | 221 | 221 | 222 | 222 | 222 | 222 | 223 | 223 | 223 | 222 | 224 | 223 | 223 | 223 | 225 |
| Commended Student | 207 | 208 | 208 | 209 | 211 | 207 | 210 | 208 | 209 | 209 | 211 | 212 | 212 | 209 | 207 | 207 | 207 | 208 | 210 |
*Restated on new scale
All classes prior to 2017 used a Selection Index ranging from 60–240. The Selection Index was calculated by adding the 20–80 scores received in Critical Reading, Math, and Writing. The new PSAT was an almost complete overhaul. The content changed. The scoring changed. The scaling changed. And the distribution of results changed. New PSAT scores consist of a Reading and Writing score (RW) and a Math score, both ranging from 160–760. As in previous periods, the RW score carries twice the weight when determining the Selection Index. The index can be calculated by dropping the zero from the 160–760 section scores, doubling RW and adding in the Math. For example, a student with a score of 720 RW and 740 Math has a Selection Index of 218 (72 x 2 + 74). Because of the weighting of RW, a Selection Index cannot be determined from the Total Score (320–1520) alone. Students with the same 1460 Total Score can have different Selection Indexes.
The Restatement Process
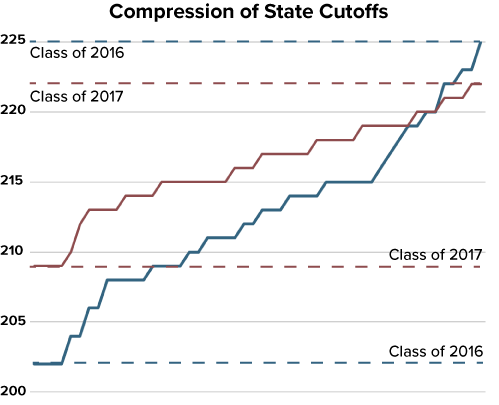
Once the NMSF cutoffs for the Class of 2017 were announced, Compass was able to produce an estimated alignment of the old and new scales. For several reasons, the structure of the new test compressed the range of NMSF cutoffs. Those at the lower end of the range increased significantly, while those at the high end stayed flat or went down. This created an odd situation where the highest possible score (228 versus 240) went down, but most cutoffs went up. These changes didn’t make it harder or easier to qualify as a Semifinalist, since essentially the same number of students qualified in the Class of 2017 in each state as qualified in the Class of 2016. The changes did, however, make it harder to interpret scores. The impact is easily seen on a stair step plot of NMSF cutoffs from lowest to highest.
 In a normal year, state cutoffs increase and decrease by small, varying amounts. One state may have a talented class or an increase in test-takers, while another has an “off” year. The scatterplot on the left shows how scores changed between 2015 and 2016—a linear relationship, as expected.
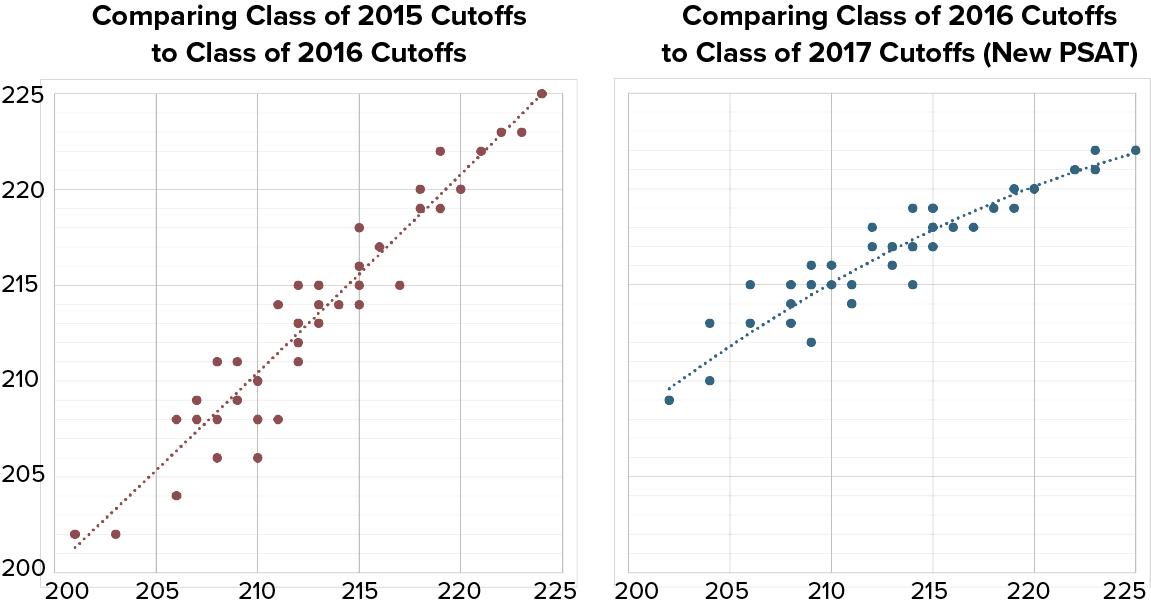 The scatterplot on the right shows how scores matched up between 2016 and 2017. By calculating a best-fit polynomial, we produced a conversion table to translate old PSAT Selection Indexes to new PSAT Selection Indexes. As can be seen in the way that points are scattered above and below the line and curve, year-to-year matchups are never perfect. A conversion table based exclusively on the 2016–2017 score changes should not be viewed as definitive. We consider it the best available comparison tool.
Below are the original cutoffs on the old PSAT:
National Merit Semifinalist Cutoffs 2009–2016 (Old PSAT Scale)
| State | 2009 | 2010 | 2011 | 2012 | 2013 | 2014 | 2015 | 2016 |
|---|---|---|---|---|---|---|---|---|
| Alabama | 209 | 208 | 210 | 211 | 209 | 211 | 207 | 209 |
| Alaska | 212 | 211 | 214 | 212 | 204 | 212 | 210 | 206 |
| Arizona | 209 | 210 | 209 | 213 | 212 | 214 | 213 | 215 |
| Arkansas | 204 | 203 | 203 | 205 | 202 | 205 | 206 | 204 |
| California | 217 | 218 | 219 | 221 | 220 | 223 | 222 | 223 |
| Colorado | 213 | 213 | 212 | 215 | 212 | 215 | 213 | 215 |
| Connecticut | 218 | 218 | 219 | 220 | 218 | 221 | 220 | 220 |
| Delaware | 219 | 219 | 215 | 217 | 215 | 218 | 215 | 216 |
| District of Columbia | 221 | 221 | 223 | 223 | 221 | 224 | 224 | 225 |
| Florida | 211 | 211 | 210 | 214 | 211 | 214 | 211 | 214 |
| Georgia | 215 | 214 | 215 | 218 | 214 | 217 | 215 | 218 |
| Hawaii | 216 | 214 | 215 | 216 | 211 | 215 | 214 | 214 |
| Idaho | 208 | 209 | 208 | 211 | 207 | 211 | 211 | 208 |
| Illinois | 214 | 214 | 214 | 216 | 213 | 216 | 215 | 215 |
| Indiana | 213 | 211 | 212 | 214 | 211 | 215 | 212 | 213 |
| Iowa | 210 | 209 | 209 | 210 | 207 | 210 | 207 | 208 |
| Kansas | 211 | 211 | 211 | 214 | 212 | 216 | 213 | 213 |
| Kentucky | 209 | 209 | 208 | 212 | 208 | 211 | 210 | 210 |
| Louisiana | 208 | 207 | 210 | 209 | 209 | 209 | 208 | 211 |
| Maine | 212 | 213 | 213 | 212 | 210 | 215 | 212 | 211 |
| Maryland | 220 | 221 | 220 | 221 | 219 | 223 | 221 | 222 |
| Massachusetts | 221 | 221 | 223 | 223 | 221 | 224 | 223 | 223 |
| Michigan | 209 | 209 | 209 | 210 | 207 | 210 | 210 | 210 |
| Minnesota | 214 | 215 | 213 | 215 | 213 | 215 | 215 | 214 |
| Mississippi | 201 | 203 | 205 | 205 | 204 | 207 | 207 | 209 |
| Missouri | 213 | 211 | 210 | 213 | 210 | 213 | 209 | 209 |
| Montana | 208 | 204 | 208 | 209 | 203 | 207 | 206 | 204 |
| Nebraska | 206 | 207 | 210 | 209 | 207 | 209 | 209 | 209 |
| Nevada | 206 | 202 | 208 | 209 | 208 | 212 | 208 | 211 |
| New Hampshire | 211 | 213 | 214 | 216 | 211 | 214 | 212 | 213 |
| New Jersey | 220 | 221 | 221 | 223 | 221 | 224 | 224 | 225 |
| New Mexico | 209 | 208 | 206 | 210 | 208 | 210 | 210 | 208 |
| New York | 216 | 218 | 217 | 219 | 215 | 219 | 218 | 219 |
| North Carolina | 215 | 214 | 214 | 217 | 213 | 215 | 212 | 215 |
| North Dakota | 201 | 202 | 202 | 204 | 200 | 204 | 201 | 202 |
| Ohio | 213 | 211 | 212 | 214 | 212 | 215 | 213 | 215 |
| Oklahoma | 208 | 207 | 206 | 209 | 206 | 210 | 206 | 208 |
| Oregon | 213 | 213 | 215 | 216 | 213 | 218 | 217 | 215 |
| Pennsylvania | 213 | 214 | 216 | 215 | 214 | 217 | 216 | 217 |
| Rhode Island | 213 | 217 | 211 | 213 | 211 | 216 | 212 | 212 |
| South Carolina | 212 | 211 | 208 | 211 | 208 | 210 | 209 | 211 |
| South Dakota | 205 | 205 | 205 | 206 | 204 | 206 | 203 | 202 |
| Tennessee | 213 | 213 | 212 | 214 | 210 | 212 | 212 | 212 |
| Texas | 215 | 216 | 215 | 219 | 216 | 219 | 218 | 220 |
| Utah | 203 | 206 | 203 | 208 | 205 | 208 | 208 | 206 |
| Vermont | 213 | 213 | 212 | 217 | 214 | 217 | 213 | 214 |
| Virginia | 219 | 218 | 218 | 220 | 217 | 222 | 219 | 222 |
| Washington | 217 | 217 | 218 | 220 | 216 | 220 | 219 | 219 |
| West Virginia | 203 | 203 | 202 | 204 | 200 | 203 | 201 | 202 |
| Wisconsin | 210 | 207 | 209 | 209 | 207 | 210 | 208 | 208 |
| Wyoming | 201 | 201 | 202 | 204 | 200 | 203 | 204 | 202 |
| ~Commended | 201 | 201 | 202 | 204 | 200 | 203 | 201 | 202 |

This is extremely helpful, thank you. I feel much more secure about my son’s 223 in CA knowing that it’s roughly equivalent to a 226+ on the old PSAT.