
Mapping the ACT
We have all heard the stories of drivers taking GPS instructions too literally and performing a “Turn Left Now” into a ditch. Navigating a standardized test poses a similar risk when students follow rules by rote. The notion of orienteering is closer to the ideal. Students have a map, a compass (my apologies for the coincidence), and a pack of knowledge to make their way through a wide range of testing challenges. Two of the most fundamental aspects students need to understand are question difficulty and pacing. I will take a look at how these come into conflict on the ACT, and how students can intelligently maneuver around obstacles.
ACT Summary
An ACT Composite score (1–36) is the rounded average of four tests (also scaled 1–36), each with its own differences in topography and pacing recommendations. In order to visualize ACT difficulty, I have created “heat maps” of the exam that show how item difficulty is spread throughout each section. Hot spots are what students want to avoid or, at least, plan for. These maps are made up of thousands of data points from 11 released ACTs. You can quickly see how different they are for each of the ACT’s four subject areas. I have provided a quick summary below and provided a deeper analysis later in the post.
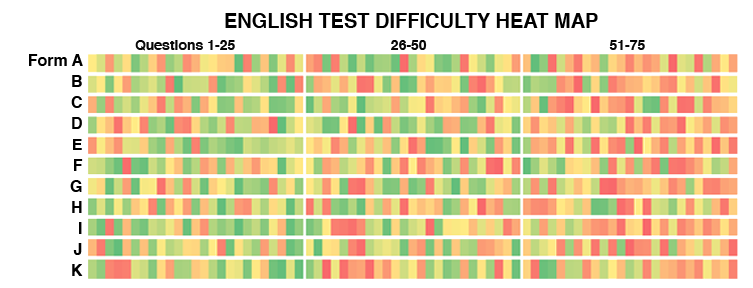
English Test (5 Passages, 75 Questions, 45 Minutes)
English passages do not increase in difficulty, and there is no pattern of difficulty within each passage. Students can push themselves for speed without hitting “killer” problems late in the test. Unlike Reading and Science, most questions appear parallel to the passage as opposed to after it; students answer as they go. This simplicity makes English an important target for higher scores.
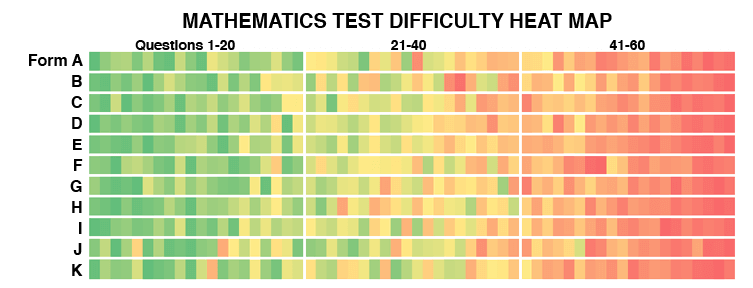
Mathematics Test (60 Questions, 60 Minutes)
Mathematics questions increase in difficulty. Problems at the end of a section consume more time (several minutes per problem, in some cases) and are far less rewarding toward a student’s overall score than earlier items. Score increases depend on improving ACT Math skills and balancing speed and power (how hard a student works at each question).
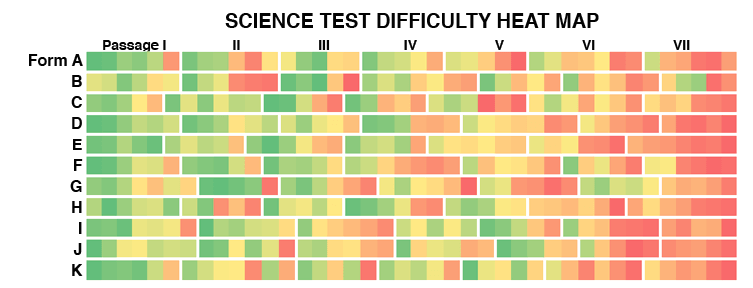
Science Test (6 or 7 Passages, 40 Questions, 35 Minutes)
Science passages increase in difficulty over the course of the test. Questions within each passage move roughly from easiest to hardest. This sawtooth pattern, combined with the speededness of the section, make Science the trickiest test to navigate.
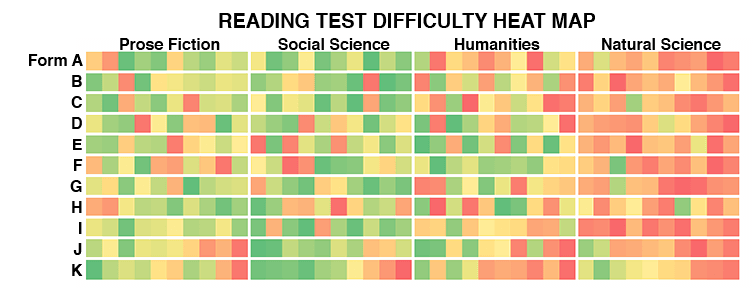
Reading Test (4 Passages, 40 Questions, 35 Minutes)
Reading passages do not increase linearly in difficulty. The biggest challenge for students is finishing the entirety (or majority) of the test. Momentum is more difficult to gain than on English, but it comes with less risk than it does with Math.
Writing Test (Optional Essay, 40 Minutes)
The essay is not a part of the Composite score. The essay score is combined with English to give a 1–36 ELA (English Language Arts) score. In this post, I focus on the multiple-choice components of the ACT.
Difficulty and Data
All too often, discussions of difficulty leave out data. I hear anecdotes about harder problems, easier test dates, harsh scales, and sections impossible to finish. It is a shame, because with millions of testers per year, there is plenty of data and science to dispel common misconceptions. Most of the figures below are accumulated from the thousands of free practice tests that Compass provides. We are able to cross-section performance in multiple ways across many different exams. This post focuses on question difficulty and pacing. Later posts will address more advanced concerns such as test-to-test equating or SAT versus ACT comparisons.
Item Difficulty as Building Block
The basic building block for all difficulty discussions is item difficulty—how often will a student of a given ability level get a question right? This simple concept allows test makers to construct an exam and helps students build a map for it. What can make the SAT and ACT so frustrating for students (and parents) is that the tests are designed for students to get a lot of questions wrong. This is not meant to be torture; it is just statistics. OK, sometimes the concepts are similar. These tests must provide insight to colleges by differentiating among students. If most test takers got 85% of questions correct, too many students would be clustered in the upper ranges to draw useful conclusions. If everyone gets a perfect score, then a perfect score is meaningless. Test makers refer to this as a “ceiling effect.”
Psychometricians (the specialists who study and design the tests) find that an ideal difficulty is for the average student to get about 55% of questions correct. You can see in the table below that a score that might produce a D in an English class can give a solidly above average score on the ACT (a Composite score of 24 is the 75th percentile and matches, approximately, 1160–1190 on the SAT). This table averages more than 20 released exams, and we have found little shift over time.
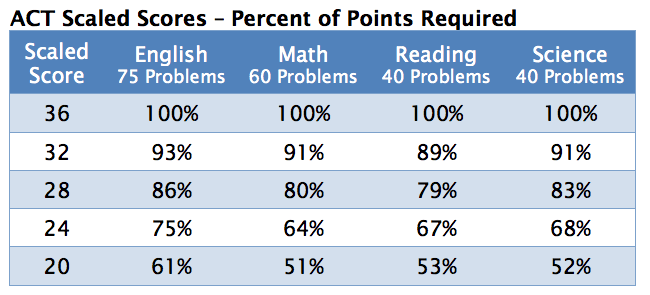
The percentages required to achieve a given scaled score are not all that different across the subject areas. English questions are a bit easier, so students must get more correct to gain an equivalent scaled score. Science has a reputation for difficulty, but it is not harder than other sections so much as it is much less pleasant—we will look into why that is.
Time and Tide Wait for No Tester
Getting from place A to place B is much easier when it is a leisurely stroll. I think of orienteering, on the other hand, as a race against the clock, the elements, and the terrain (some students might argue that orienteering on the ACT is akin to being dropped in enemy territory and attempting a successful extraction). Difficulty of items and test timing are inextricably linked. The SAT and ACT are referred to as “speeded” tests, because a student’s ability to work through every last problem is constrained by the clock. The ACT’s sheer volume of words, equations, and diagrams can be overwhelming. [In fairness, things are not much different over at the SAT.] Why does it have to be like this?
The Test Maker’s Dilemma
Imagine yourself a test maker. If you could offer an 8-hour exam, you would have lots of room to ask an array of questions of all different difficulty levels. You might achieve a deeper understanding of student skills in more sub-areas. You could probably forgo demanding time limits. It seems like a dream, except that no one would take your test. It would be too expensive, too long, and not that much more accurate or predictive than the speeded 3–4 hour exams that we face today. The pace at which students can complete a task turns out to be a useful proxy for mastery.
Measuring Elevation. Managing Difficulty.
A topographic map provides elevation in addition to distance; a contour line represents a fixed change in elevation. We need that extra information to avoid mishaps (such as navigating into or over a cliff). We can think of the contour line on an ACT map as deriving from how a raw score is calculated—every problem is worth a single point (scaled scores are a bit different). The hardest question gives no scoring benefit over the easiest. Why does this matter?
I can use this information for cliff avoidance and toward using my time wisely. Moving 100 feet up Everest would give me the same elevation change as walking 100 feet up a trail in Griffith Park or the Marin Headlands, but the difference in time and energy commitment is immense. We find the exact same thing on the ACT—especially on the Science and Math Tests. At the ends of these tests, students may need several minutes to complete a problem, only to find that they are 50% less likely to gain a point than they were 15 problems earlier. Students cannot afford such poor returns on invested time if they are to excel on the ACT.
I often read that students “just need to work faster” or should “scan for easy” problems so that they do not miss out on points. When not tailored to the student’s specific situation, this can be horrible advice. On some ACT sections and in some places, speed is essential. In other situations, speed kills. Moreover, questions do not have labels on them saying “easy points here.” Hard problems are sometimes difficult because they look temptingly easy. Let’s turn to the data.
Navigating Math: Difficult Questions are Closer Than They Appear
The Math Test has the steadiest progression of difficulty—from its easy “solve-for-x” beginnings to the time-consuming puzzlers at the end. Students moving too quickly can be punished. For most students, the notion that they must “hurry through the first problems so that they have enough time for the difficult problems” is “Turn Left Now” into quicksand.
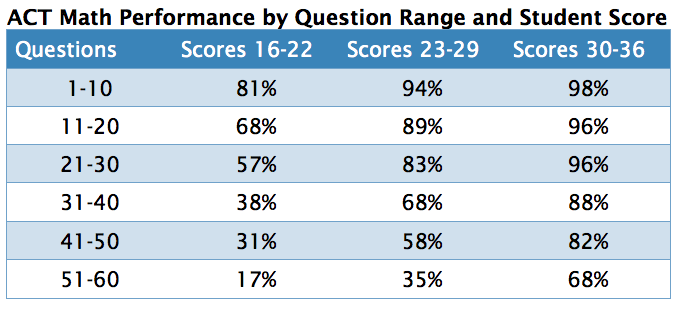
Below is a table showing how students at different score ranges performed on different portions of one ACT Math Test that I will refer to as Form D (this form is typical and will be the one used for many of the tables). The percentages are how many raw points the students earned versus the potential points (1 per problem).
The Concept of “Points Above Guessing” (PAG)
It is tempting to look at the numbers for 16–22 students and note that they are still picking up points on the last 20 questions. There are two problems with that interpretation. First, the ACT has no guessing penalty, and each Math question has 5 answer choices; pure random guessing should achieve 20% of the available points. Second, hard problems soak up time. Lots of time. It is not uncommon for one of the harder questions to take four times as long as an easier problem. To account for random guessing, I have provided another way of looking at the data in the table below—how many points are students earning versus how many points earned above a student guessing randomly?
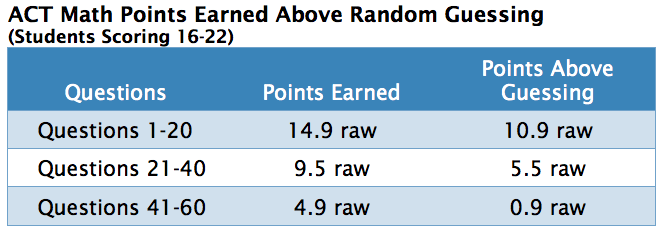
We could estimate that for every 20 problems, a random guesser would average 4 correct answers. The only sensible reason to invest time in a problem is to do better than random. The Composite 16–22 students in our sample population are doing 20 of the hardest questions and coming away with less than 1 raw Point Above Guessing (PAG). They get 12 times the PAG on the first third as they do on the final third. You can also see that they still have ample room for improvement on questions 1–40. The sample population for this test represents first-time testers, so it is not surprising that their orienteering skills are underdeveloped.
What About Higher Scoring Students?
While the impact of difficulty ladder, timing strategy, and guessing strategy is most noticeable for the 16–22 scoring group, we can zoom in to see the same sort of impact for students scoring 23–29 (67th to 93rd percentiles, so strong Math testers).
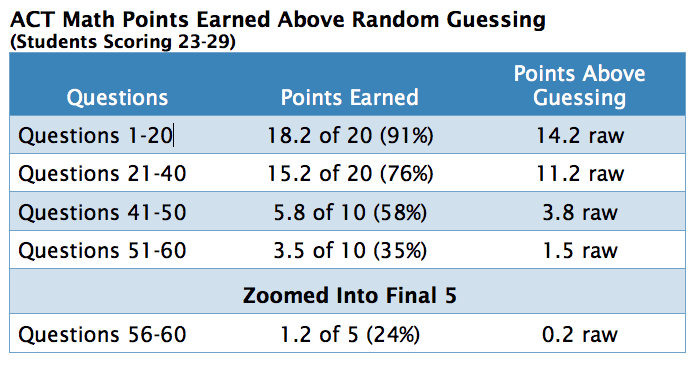
On questions 51–60, these students gained only 1.5 PAG. On the last 5 questions, they barely beat out a random guesser. Again, the penalty is not just missing out on points, it is the awful return on invested time. In an effort to avoid being “left out,” students often end up on problems above their optimal range. For example, students scoring below the 90th percentile (approximately 27 or lower) are better off letting questions 56–60 be someone else’s headache.
Tipping Points
Most students reach a tipping point where they move from correctly answering all or most questions to struggling with many or most questions. As they reach this point, problems also start consuming larger chunks of time. It is tempting to follow the orienteering theme and label this the Point of No Return. A more fitting name might be the Return of No Points. For most students, score increases on Math come from improving their performance before and close to that tipping point. Blowing past simply to attempt every problem is not sound strategy. It is the over-or-into-a-cliff route.
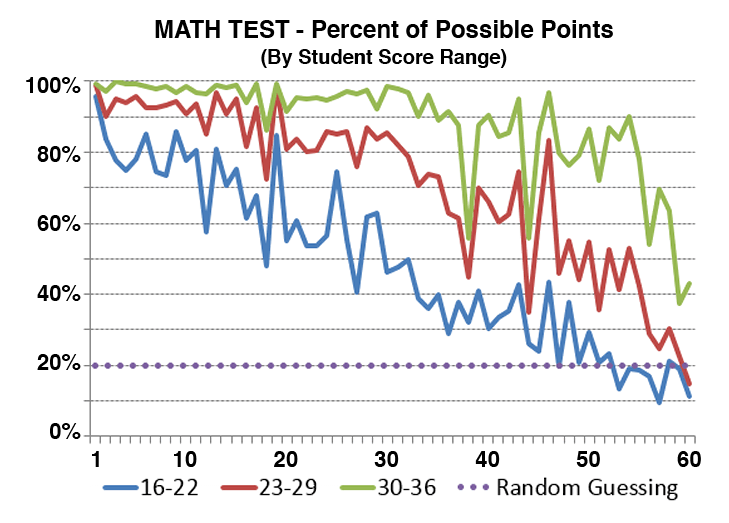
Where that tipping point falls is highly dependent upon a student’s score. Below is a chart of students’ performance on Form D broken into three score ranges. By problem 30, the 16 to 22 scorers fall below 50% correct answers (recall that 20% would be random guessing). The 23 to 29 cohort hits the same mark at problem 49. The 30 to 36 scorers hold out until question 58. Other than smoothing out the data, the curves would look much the same if we were to plot multiple tests.
The Curse of the Outlier
It is possible to find an exception to every rule. Somewhere in ACT-land there is a Math problem #52 that is easier than a Math problem #42. It is tempting to use that as an excuse to “scan” the test for “easy” problems. An outlier is used to justify a bad decision. Sometimes the “Bridge Out Ahead” sign is wrong; still, the best decision is to turn back. Once more, it comes down to return on invested time. It takes time to scan problems. It takes time to assess the difficulty of an item. It takes even more time to judge how long the problem will require to answer. Finally, one must actually solve the problem to claim the point. The return is not there if the student strays too far off the optimal course.
Blanking Out
The 16–22 scorers left an average of 4.6 items blank on the Form D Math Test. They either ran out of time when the proctor called “pencils down,” did not realize that there was no penalty for guessing, or had forgotten to come back to a problem. Whatever the reason, these students lost almost a full raw point for the simple fact of not bubbling in an answer to every question. There is no point deduction for wrong answers on the ACT, so THERE IS NO REASON TO EVER LEAVE AN ACT QUESTION BLANK [I apologize for yelling, but it is a fundamental part of the ACT—and the current SAT.] These students were first time ACT takers, and some students—through no fault of their own—bring along bad habits. The old SAT (offered for the last time in January 2016) deducted 1/4 point for wrong multiple-choice answers, so the strategy there was more nuanced and conflicted with the BUBBLE EVERYTHING approach of the ACT and current SAT. Students must understand the topography of each test.
Mapping Science: A Bumpy Ride
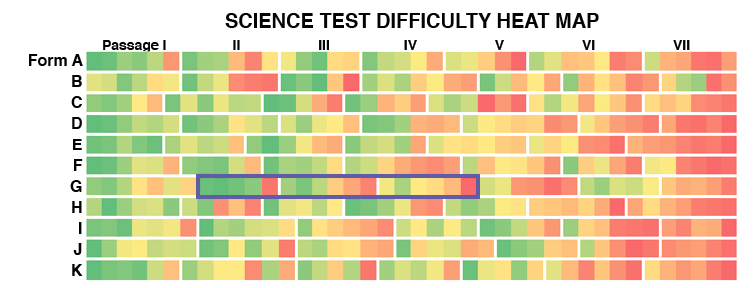
Science does not reveal its secrets until you pay closer attention to the passages and their transitions (passages are outlined in white). It is a rumbling roller coaster of a trail that moves from easy to hard, easy to hard, medium to hard and so on until its final harrowing passages. I have highlighted an area of the heat map where the trend is particularly easy to see over several passages.
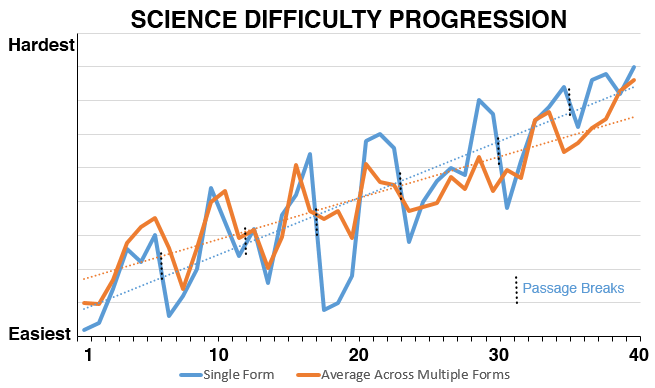
Averaging Science question difficulty by problem number can be misleading, because it neglects that passages begin and end in different places on each test. Still, in the table below, I’ve provided the average line (orange) to stay consistent with Math. Also included is the example Form D (blue). In both cases, the trend line is obvious, and you can see the various peaks and valleys. The passage breaks are shown on the single form to indicate how quickly difficulty shifts from a passage’s end to a new passage’s beginning. The breaks are almost always preceded by a high (a difficult problem) followed by a drop (an easier problem).
“The race is not always to the swift, nor the battle to the strong, but that’s the way to bet.” – Damon Runyon
As on Math, we need to be careful about succumbing to the Curse of the Outlier. On these 11 tests, there are the occasional outliers—problems that end up easier than they should be. Damon Runyon’s hard-boiled take on Ecclesiastes is a reminder that you do not get a return on investment betting on these infrequent outliers. It’s one thing when a long-shot pays 50–1, and quite another when it pays 1–1. Students must never forget that there is no ACT Award for Difficulty.
We can better observe progression of difficulty on ACT Science by looking at the data at the passage level. Rather than merely graphing things by rank, the chart below is based on student performance—what percentage of questions did they answer correctly. Students do well on initial passages and poorer on the later passages. A “gimme” question would be close to 100%. In theory, the baseline on ACT Science should be 25%, as there are only 4 answers from which to choose. We find that in real life, things can get worse than random guessing. On the hardest Science questions, a wrong answer (a distractor in test-speak) can be more tempting than the correct answer. The chart below is based on over 1,000 students for Form D scoring between 16 and 20 on Science.
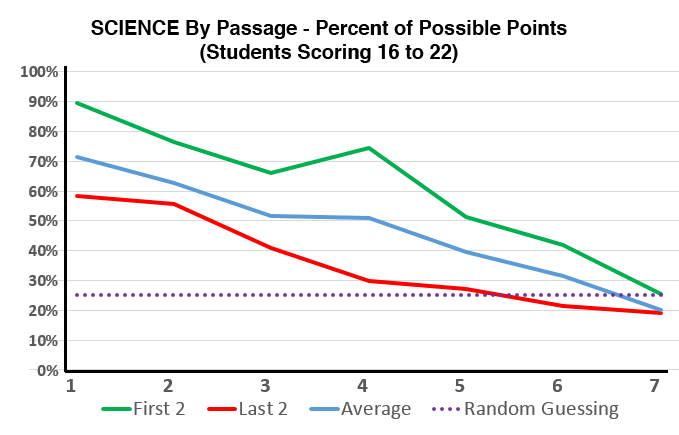
Interpreting Difficulty by Passage
There is a lot going on in the chart. The green and red lines show the performance on the first two questions and last two questions of each passage, respectively. The blue line is the overall average for a passage. The dotted line is the 25% random guessing baseline. On the seventh passage of this particular test, the 16–22 (average score of just under 20) students did worse than guessing. [I have presented this group of average scorers only because the data is that much starker. The difficulty pattern remains the same across all score ranges.] They performed below guessing levels at the end of Passage VI, as well. As with Math, the real damage is done from the time spent on these hard problems. If all that these students did on Passage VII were to bubble in random answers, they would have had more time for the preceding passages. Students can easily be confused by mixed messages: Speed is important. Don’t go too fast. That both are true is why practice is so important.
The gap between green line and red line shows the difference in difficulty between the first two items of a passage and the last two. These students are getting 25% fewer points on the late-in-the-passage questions. Given that these students are only averaging 47% right across the Science Test, this difference can be viewed as another cliff.
Fight or Move Forward?
For this group of 16 to 22 scorers, the first questions from Passage VI were actually easier than the final questions from Passages IV and V. In figuring out a student’s map, the difficulty of individual problems must be offset against the time involved in plunging into the next passage. In other words, “Is it better for me to answer the last questions of Passage V or try to pick off a couple of points from Passage VI?” As I have tried to emphasize, the findings should always be applied with an eye toward the individual student’s performance—teaching a student orienteering tools instead of giving the false confidence of “Turn Left Here.”
“I know that the first questions of Passage II will be easier than the last questions of Passage I. So shouldn’t I just skip over those harder questions and move on to Passage II?” No! Every test taker should be aiming to get through at least 4–5 passages. If you are going to answer a question anyway, you are almost always better off doing it right away (which also includes problems where you need to cut your losses and move on). The strategy starts to come into play when you near your tipping point. It may make more sense to get to the easiest questions of Passage VI instead of flailing away at the end of Passage V. Some students have no tipping point. A student regularly scoring 32–36, for example, must reach all of the passages and most of the questions. Orienteering should not be confused with overthinking. Sometimes students try too hard to outsmart the test, when the easier route is answering the question.
Does Passage Type or Position Matter More?
Another element in our multidimensional map is passage type. ACT Science presents its pieces in the styles of a Data Representation piece, a Research Summaries piece, and a Conflicting Viewpoints piece. Previously, ACT had three examples of the first two types and a single Conflicting Viewpoints, but recently we have seen this mix change slightly from test-to-test (and the passage count vibrate between 6 and 7). If I were to identify the passage type, what added information does this provide? Is it best to avoid Conflicting Viewpoints questions? Are Data Representation passages easier than Research Summaries passages? Should I skip one of them?
A finding of our research into thousands of scores is that the common perception that there are easier and harder Science passage types is not borne out by the data. Conflicting Viewpoints passages are, on average, more difficult, but not more difficult than we would expect a similarly located passage to be. In other words, if you are on Passage V and you hit a Conflicting Viewpoints, it is no worse than if you hit a Data Representation at Passage V. It is true that you are more likely to see Conflicting Viewpoints passages later on the test. ACT can mix up passage types in any order it chooses, so the best map to follow is based on passage position and not type.
No Need to Classify
A student hitting a Passage V Conflicting Viewpoints might be tempted to skip ahead to a Research Summaries on Passage VI or VII. Our data shows that this is a mistake and that, on the whole, students will do better by taking passages in order. An added benefit of this approach is that students need not worry about classifying passage types. Under the pressure of the exam, it is easy for students to confuse a Data Representation with a Research Summaries, for example. Fortunately, the solution is to not spend any time worrying about it. The simplest and most accurate rule has nothing to do with passage type and requires virtually no added time to figure out: Passage II is [almost always] harder than Passage I. Passage III is harder than Passage II. Passage VI is harder than Passage V.
Know How to Pace Yourself
For many years, identifying the type of Science passage was as easy as counting the number of associated questions. However, over the past few years, ACT has varied the number of questions per passage within each passage type. Additionally, while there are usually 6 passages per test, it is best for students to verify this at the start of any Science Test. Flipping to the end of the Science Test is now as important as looking up your destination in Google Maps. The Science Test is already a bumpy ride; you do not want any surprises at the end of it. Consider keeping track of pacing by using question count rather than passage count milestones. No matter what practice test or real test you take, the Science Test will always have 40 questions. You should know where you want to be on the clock after 10, 20, and 30 questions.
Mapping English: Candy-Colored Questions
The heat map for ACT English resembles—to this avid moviegoer—a spilled box of Mike and Ike candies, with easy, medium, and difficult problems mixed throughout the test—the green being the sweetest of all. I’ve broken the test into thirds to give some sense of transitions. Passage breaks are less relevant, because there is no dramatic shift in difficulty. English has 5 passages, but the number of questions related to each passage can vary slightly from the mean of 15.
Canceling the Noise
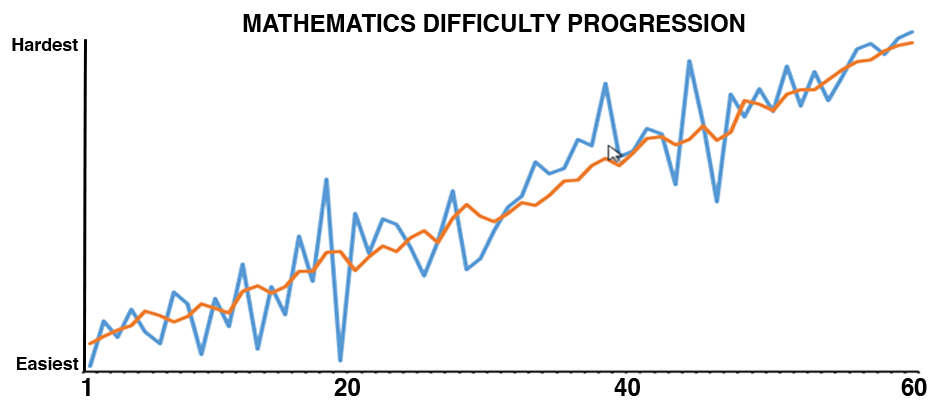
Most students (not all) know to fill in an answer for every ACT question. This creates a bit of noise when analyzing question difficulty toward the end of a test. Did students do poorly on an item because they did not reach it or because the question was too hard? Although it is beyond the scope of this post, we can often glean information from the pattern of wrong answers across large numbers of students. Attempted problems show wrong answers clustered around the most popular distractor choices. Rapidly bubbled items show a more random pattern. An easier way of showing the weak correlation between question number and difficulty is to only look at the first 60 questions. After that point, time pressure comes into play for many students. As you see in the chart below, the variability is large, and the fit with a linear trend is very poor—which is a fancy way of saying that difficulty bounces somewhat randomly throughout the test. In fact, you rarely need to go more than one or two tough questions before catching a breather with an easier question or two.
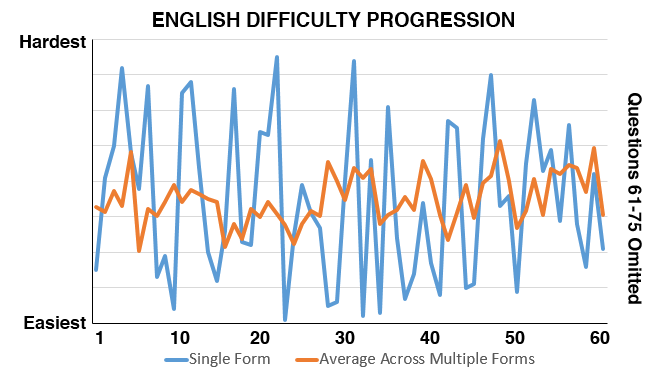
Within a passage, English questions are tied to line order, so ACT test makers do not have the ability to present items by difficulty as they do with Science. Difficult ACT English questions tend to exploit subtle or unexpected grammar and punctuation rules. They do not stand out in the same way that a hard Math question stands out. While some Rhetorical Skills questions can take added time, they prove to be of similar overall difficulty to Usage/Mechanics. On the Math Test, a student moving more quickly is hit with harder problems. On the English Test, the student will find questions not all that much different from the ones they faced at the beginning of the section. Improved speed is more of an unalloyed benefit on English. There is always an easier question around the next bend.
Mapping Reading
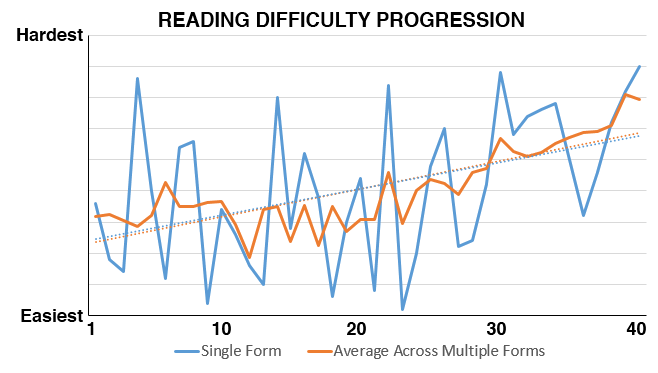
The Reading Heat Map shows that students start to run low on time as they work on the third and fourth passages. ACT Reading is a special case when it comes to passage order. The test always has a Literary Narrative or Prose Fiction, Social Science, Humanities, and Natural Science passage in that order. There appears to be added difficulty on the latter two passages, but much of that is an artifact of time limitations. An interesting experiment would be to re-sort the passages and measure student performance.
The Test Taking Rebel and the Bubble Sheet Shift
In looking at the plot of difficulty rank for our set of 11 forms and for our exemplar, the trend lines clearly go up, but you can see how poor the fit is. As with English, if you were to truncate the data after question 30, you would little trend or correlation. Question to question variability is high. Overall, our sample of several thousand students did slightly better on Social Science (Passage II) than on Prose Fiction (Passage I) and did more poorly on the second half of the test than the first. This is an example, though, of where overthinking can get in the way. Every student should be trying to get at least as far as the Humanities (III) passage. Mixing things up by moving from Social Studies (II) to Prose Fiction (I) to Humanities (III) to Natural Science (IV) might mark a test taker as a rebel, but it would serve no purpose toward raising the student’s score. Whenever skipping around, a student risks the most dreaded of test day errors—the Bubble Sheet Shift. Erasing and redoing 20 answers is not a productive use of time.
No Front-Loading
Unlike Science, Reading does not front-load easier questions at the start of a passage block, so trying to pick-off questions by location alone does not work as a strategy. The orienteer needs to work on getting quickly through the reading passage and into the questions. Improved speed on Reading is not hindered by steadily increasing difficulty. There appears to be no solid reason for taking passages out of order or abandoning a passage midway through its questions. Although uncommon, there are situations where individual students may have brain-lock on a particular passage. If that happens, it does make sense to move away and try other passages. Upon returning, students may find that things are clearer. Some students have allergies to certain passage types, but their reactions are usually far more exaggerated than the results. Students can encounter hard questions on any passage and at any point. The focus of Reading preparation should be on achieving sufficient speed and recognizing when to throw in the towel on a problem.
Paired Passage
As of the June 2014 exam, ACT makes one of the passages on each test into a “paired passage”—usually two perspectives on a shared topic. The question count remains at 10, with 3–4 questions referring to the first passage/author, 3–4 questions on the second passage/author, and 2–3 questions comparing or contrasting the styles or viewpoints. This passage was added to better align the ACT Reading with academic standards—including the Common Core—that expect students to compare texts. ACT did not change the overall difficulty of Reading with this change, and we find that the paired passage is not more difficult than a regular passage. The SAT has had this type of paired passage for quite some time.
Map. Practice. Perform.
In little ways and in big ways, ACT takers are constantly challenged to find an optimal path. Students are greatly dependent on their own pacing and navigational skills. No one will tap you on the shoulder during the 60-minute Math Test and warn you to move more quickly. GPS is not allowed in the testing room.
Updated October 20, 2018</strong

Hi, I am a student and recently preparing for ACT Test. I have a question here. You mentioned the data points you used are all based on the 11 released ACTs. Is it the actual ACT tests you use for experimentation? Thanks!
Yes, the data are from actual ACTs.
Oh 🙂 Really? Which ACT tests? It is quite hardly for me to accept this. Is the compass prep so good?
I’m clearly biased about Compass Prep quality, so I may not be the best person to answer that one. You are welcome to talk with one of our directors for more information about our programs.
I’m not biased about difficulty levels on ACT problems. I think it is fairly well established that Math questions roughly increase in difficulty, Science passages get harder and questions within the passages get harder, and Reading and English don’t follow these patterns. This work was done to give our tutors and students additional insights into the ACT based on the performance of many students. I chose to share the findings, but I have kept some of the data private. I can assure you that I have no agenda. Dissent is good, though, and if you are thinking about these topics, you must be taking your prep seriously. Best of luck.
Very cool article, but I have one bone to pick: On the Science section, isn’t a great deal of the heat map and “difficulty” of the questions on later Science passages simply due to the fact that many ACT test takers are guessing (or at least rushing) by that point? I don’t believe it is clearly established that later Science passages are clearly harder than earlier ones.
Jerry,
You bring up a valid concern and one that I believe that I raise — at least in terms of interpreting the Reading (please don’t make me reread my entire post!). The difference between Reading and Science is that we start picking up hints of increasing difficulty even by passages 2-4. The number of students running out of time on these passages is quite low. Most students attack passages in linear fashion, so it is true that much of the red on the final passage can be attributed to the section’s “speededness.” This is also why I don’t conclude that the Natural Science passage on Reading is necessarily more difficult than other passages — many of the mistakes are the result of having less time left to complete the passage.
I am more confident about the backloading of difficult questions in each Science passage, as most students try to finish off all problems before jumping to the next section. It’s also easier to see the trickiness of those problems (assessing the overall difficulty of a passage without good statistics is much harder). A case that I try to make with students is that skipping around to find “easier” passages is usually misguided. There is certainly no evidence that later passages are easier, and skipping around has costs in terms of the tame spent making assessments and in the potential it adds for dangerous meltdowns such as mis-gridding or overlooking a passage.
The best way for me to test the theory is to shuffle the passages. However, my ethics get in the way of making students guinea pigs to advance my theories.
Thanks for the translucent breakdown of the English section. I remember similar maps of the Math back in the Dark Ages when I took the ACT. I’ve been trying to take my ESL students through the English test, and it is hard to predict which problems they will miss. Sometimes it is the actual question that stumps them, but sometimes it is vocabulary in the passage that native speakers will just know. Has anyone that you know of including Compass, made a list of common words that appear on the ACT? I remember one for the SAT before it was revised.
Lindsey,
We haven’t found vocabulary work to be an effective test prep method for our students. That said, it sounds like yours is a special case. I’m sorry that I don’t have a specific recommendation. There are a number of books and flashcard sets available, but I don’t have experience with them.