
Compass projects lower qualifying scores for the Class of 2027
Every year, Compass tracks the National Merit process from the PSAT in October of junior year through the announcement of Semifinalists in September of senior year. One of the most important insights comes in April with the reveal of the national Commended cutoff. Compass has confirmed that this year’s Commended level is 208, down from last year’s 210. There has never been a year when all 50 states see lower cutoffs, but this year may come close. The Class of 2026 saw record Semifinalist cutoffs in 21 states; this year, Compass projects none. Our Semifinalist estimates have been updated with the latest information.
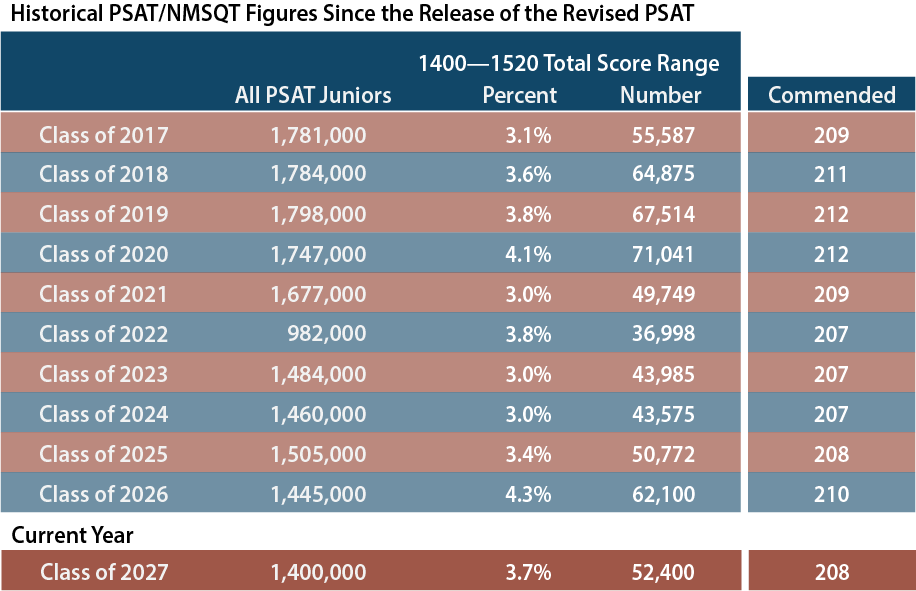
The junior-year PSAT is also the National Merit Scholarship Qualifying Test (NMSQT). Each year, National Merit recognizes the top 57,000 test takers. To be included in that group, students must be among the top 4% of the 1.4 million students who take the PSAT. Of that elite group, approximately 17,000 are recognized as Semifinalists for having the highest scores within their states. Semifinalists have the opportunity to continue in the program to become Finalists and, potentially, scholarship recipients. The remaining 40,000 students are recognized as Commended Students. More information can be found in our National Merit Explained post.
National Merit uses the Selection Index (SI), found on the PSAT score report, to rank students. The Selection Index is calculated by doubling the Reading & Writing score (RW), adding the Math score (M), and dividing that sum by 10. For example, a student with a 720 RW and 700 M score has a Selection Index of 214: (720 x 2 + 700) ÷ 10. The weighting of the index means that not all students with a 1420 Total Score have the same SI. A student with a 700 RW and 720 M has a Selection Index of 212. The highest SI a student can receive is 228 (760 RW and 760 M). Last year, the Commended cutoff was 210, and Semifinalist cutoffs ranged from 210 to 225 depending on the competitiveness of each state. Compass expects this year’s cutoffs to range from 208 to 223.
Why do we foresee lower cutoff scores?
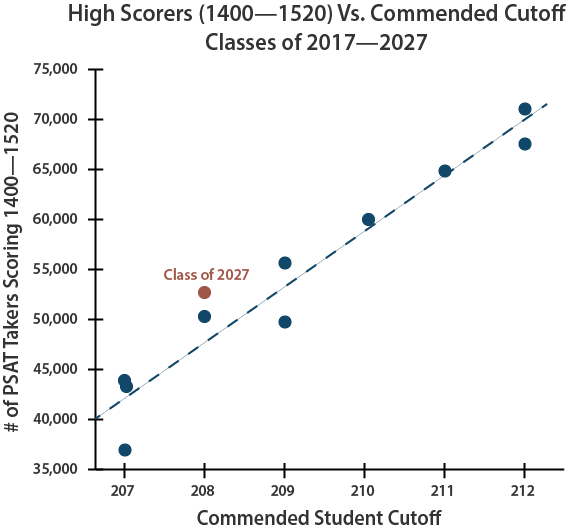
The first indication of a decline was the lower number of top scorers reported by College Board when PSAT results were released in November. College Board does not release any information about the distribution of Selection Indexes, but it does produce summaries of broad score ranges. Only 52,400 students in the Class of 2027 earned scores in the 1400 – 1520 Total Score range, down 16% from the previous year. That figure is closer to what we saw two years ago with the Class of 2025 and is similar to the results for the Classes of 2017 and 2021.
Most of the students who will qualify for National Merit recognition fall in the 1400 – 1520 band (or just outside it). With approximately 10,000 fewer students in the top band of scores this year, the Commended cutoff was bound to decline. The chart below shows the historical relationship between high scores and the Commended cutoff.
A big drop after last year’s record levels
After examining this year’s numbers, we also have a better understanding of why Semifinalist cutoffs jumped to such extreme levels last year, and why that is unlikely to happen again. The 2024 PSAT saw an unprecedented 18% jump in the number of high Reading & Writing scores (700-760). The weighting of RW in the Selection Index magnified the impact of that change. The table below shows scores for the last three years and how results have fluctuated.

On the 2025 PSAT, the number of high RW scores dropped by 27%. In fact, the RW count for this year is even lower than it was two years ago. The decline in RW scores could even produce Selection Indexes lower than those in the Class of 2025 — at least in some states.
On the October 2024 PSAT, almost as many students scored 700-760 on RW as on Math. Based on the results in the highest scoring states, we know that a record number of students achieved 750 and 760 RW scores. In most years, there would be more students scoring 730 RW and 760 M (222 SI), for example, than scoring 760 RW and 730 M (225 SI). That was not true in the Class of 2025, where there was a more equal distribution. It appears that scores for the Class of 2027 have returned to the traditional Math-heavy distribution. For this reason, we don’t believe there will be a repeat of the 224 and 225 cutoffs seen last year.
We anticipate that the majority of state Semifinalist cutoffs will decline for the Class of 2027. Knowing this overall trend, however, doesn’t tell us which states will be in that majority or how much lower scores will go. The table below provides a Most Likely cutoff score, but the more useful information is the Estimated Range. Almost all cutoffs should fall within that range.
| State | Class of 2027 (Most Likely) | Class of 2027 (Est. Range) | Class of 2026 (Actual) | Class of 2025 (Actual) | Class of 2024 (Actual) | Avg NMSFs |
|---|---|---|---|---|---|---|
| Alabama | 213 | 210 - 215 | 214 | 212 | 210 | 250 |
| Alaska | 213 | 210 - 216 | 215 | 214 | 209 | 35 |
| Arizona | 218 | 215 - 220 | 218 | 217 | 216 | 398 |
| Arkansas | 213 | 210 - 215 | 215 | 213 | 210 | 143 |
| California | 221 | 220 - 223 | 224 | 221 | 221 | 2,115 |
| Colorado | 218 | 216 - 220 | 219 | 218 | 216 | 286 |
| Connecticut | 221 | 220 - 222 | 223 | 221 | 221 | 175 |
| Delaware | 219 | 218 - 221 | 220 | 219 | 219 | 44 |
| District of Columbia | 223 | 222 - 224 | 225 | 223 | 223 | 36 |
| Florida | 217 | 216 - 219 | 219 | 217 | 216 | 999 |
| Georgia | 219 | 217 - 220 | 220 | 218 | 217 | 602 |
| Hawaii | 217 | 215 - 219 | 219 | 217 | 217 | 62 |
| Idaho | 214 | 211 - 216 | 215 | 213 | 211 | 96 |
| Illinois | 220 | 218 - 222 | 222 | 220 | 219 | 704 |
| Indiana | 216 | 214 - 219 | 218 | 217 | 216 | 313 |
| Iowa | 213 | 211 - 216 | 214 | 212 | 210 | 145 |
| Kansas | 215 | 213 - 218 | 216 | 215 | 214 | 144 |
| Kentucky | 214 | 211 - 217 | 214 | 213 | 211 | 201 |
| Louisiana | 214 | 212 - 217 | 216 | 214 | 214 | 222 |
| Maine | 214 | 212 - 217 | 217 | 214 | 213 | 55 |
| Maryland | 222 | 220 - 224 | 224 | 222 | 221 | 308 |
| Massachusetts | 223 | 221 - 224 | 225 | 223 | 222 | 318 |
| Michigan | 218 | 216 - 220 | 220 | 218 | 217 | 485 |
| Minnesota | 218 | 216 - 220 | 219 | 217 | 216 | 279 |
| Mississippi | 212 | 210 - 214 | 213 | 212 | 209 | 155 |
| Missouri | 215 | 213 - 218 | 217 | 215 | 214 | 289 |
| Montana | 210 | 208 - 213 | 213 | 209 | 209 | 47 |
| Nebraska | 212 | 210 - 215 | 214 | 211 | 210 | 105 |
| Nevada | 214 | 211 - 216 | 214 | 214 | 211 | 168 |
| New Hampshire | 216 | 214 - 219 | 219 | 217 | 215 | 60 |
| New Jersey | 223 | 222 - 224 | 225 | 223 | 223 | 451 |
| New Mexico | 212 | 209 - 214 | 210 | 211 | 207 | 104 |
| New York | 220 | 219 - 223 | 223 | 220 | 220 | 1,012 |
| North Carolina | 218 | 216 - 220 | 220 | 218 | 217 | 510 |
| North Dakota | 209 | 208 - 212 | 210 | 210 | 207 | 30 |
| Ohio | 217 | 215 - 219 | 219 | 217 | 216 | 538 |
| Oklahoma | 212 | 210 - 214 | 212 | 211 | 208 | 204 |
| Oregon | 217 | 215 - 220 | 219 | 216 | 216 | 188 |
| Pennsylvania | 219 | 217 - 221 | 221 | 219 | 219 | 596 |
| Rhode Island | 217 | 214 - 219 | 219 | 217 | 215 | 47 |
| South Carolina | 214 | 210 - 216 | 215 | 214 | 209 | 236 |
| South Dakota | 209 | 208 - 212 | 211 | 208 | 209 | 42 |
| Tennessee | 217 | 215 - 219 | 219 | 217 | 217 | 319 |
| Texas | 219 | 218 - 222 | 222 | 219 | 219 | 1,623 |
| Utah | 212 | 210 - 215 | 213 | 211 | 209 | 196 |
| Vermont | 214 | 211 - 216 | 216 | 215 | 212 | 28 |
| Virginia | 222 | 220 - 224 | 224 | 222 | 219 | 437 |
| Washington | 222 | 220 - 224 | 224 | 222 | 220 | 348 |
| West Virginia | 208 | 208 - 211 | 210 | 209 | 207 | 64 |
| Wisconsin | 214 | 213 - 217 | 215 | 214 | 213 | 292 |
| Wyoming | 209 | 208 - 212 | 210 | 209 | 207 | 24 |
| U.S. Territories | 208 | 208 - 208 | 210 | 208 | 207 | 39 |
| Outside U.S. | 223 | 222 - 224 | 225 | 223 | 223 | 86 |
| Commended | 208 | 208 - 208 | 210 | 208 | 207 |
Was last year a fluke, shift, or a trend?
The results from the Class of 2027 have answered one of the nagging questions from last year: Were the high cutoffs a fluke, shift, or trend? The answer appears to be fluke. More accurately, results could be labeled an error in test construction and scaling. There is no evidence that the Class of 2026 possessed special test-taking skills. As sophomores, that class performed in line with expectations on the 2023 PSAT. There is no evidence that the Class of 2027 has diminished skills. As sophomores, the class saw the same inflated scores as did the juniors on the 2024 PSAT. The best explanation is that College Board lost control of the scale. College Board dramatically shortened the PSAT when it switched from paper to digital. On the paper test, the Reading and Writing sections had 91 questions, and students were given 95 minutes. The RW on the digital PSAT is truncated to 54 questions over 64 minutes. And only 50 of the questions count toward a student’s score! A shorter exam means a less reliable exam. We saw the occasional wild ride on the paper PSAT, but the rides may get wilder and more frequent on the digital PSAT.
How cutoffs are determined
Qualifying scores (“cutoffs”) are not based on the total score for the PSAT (360-1520) but on the Selection Index, which is calculated by doubling the RW score, adding the Math score, and then dividing the sum by 10. The maximum Selection Index is 228. Students can find a historical set of cutoff data here or see how Semifinalist and Commended counts have changed state by state.
While the Commended cutoff is the same across the entire country, Semifinalists cutoffs vary by state. NMSC allocates a target number of Semifinalists to states based on their population of high school juniors, not all of whom take the PSAT. If Florida is allocated 1,000 Semifinalists based on its population of high school graduates, then NMSC works down from a perfect 228 Selection Index until it gets as close as possible to that target. Last year, 1,008 students scored at or above the cutoff of 219. A cutoff of 220 would have produced too few Semifinalists. A cutoff of 218 would have gone over the allocation. Because score levels can get crowded, it is easy for cutoffs to move up or down a point even when there is minimal change in testing behavior or performance. All students at or above a cutoff qualify.
Why does each state have its own Semifinalist cutoff if the program is NATIONAL Merit?
This is always a hot button question. NMSC allocates the approximately 17,000 Semifinalists among states based on the number of high school graduates. That way, students across the nation are represented. It also means that there are very different qualifying standards from state to state. A Massachusetts student with a 220 might miss out on being a Semifinalist. If she lived 10 miles away in New Hampshire, she would qualify.
No Semifinalist cutoff can be lower than the national Commended level. Cutoffs for the District of Columbia and for U.S. students studying abroad are set at the highest state cutoff (typically New Jersey). The cutoff for students in U.S. territories and possessions falls at the Commended level each year. Boarding schools are grouped by region. The cutoff for a given region is the highest state cutoff within the region.
Change is always the theme
Over the last two decades, at least half of the state cutoffs have changed each year. In some years, as many as 49 states saw ups or downs, usually because of questionable test forms. In addition to last year’s exam, the PSATs from 2011 (Class of 2013), 2016 (Class of 2018), and 2019 stand out as problematic. The anomalous 2019 results could be traced back to a particularly mis-scaled form, which I wrote about at the time. The Class of 2014 also saw significant changes, but those were more of a bounce-back from the previous year. The question for the Class of 2027 is how much of a bounce-back will be seen this year.

Cutoffs are particularly bumpy in states with smaller pools of test takers and National Merit Semifinalists. Over the last dozen years, cutoffs in the 12 largest states have remain unchanged 36% of the time, while the cutoffs in the smallest states have remain unchanged only 1 time out of every 5. No large state’s cutoff has jumped by more than 3 points in a year, whereas 6-point changes have occurred in the pool of smaller states.

When are National Merit Semifinalists announced?
The lists of Semifinalists will not be distributed to high schools until the end of August 2026. With the exception of homeschoolers, students do not receive direct notification. NMSC asks that schools not share the results publicly until the end of the press embargo in mid-September, but schools are allowed to notify students privately before that date. NMSC does not send Commended Student letters to high schools until mid-September. Compass will keep students updated on developments as the dates approach.
Do state and national percentiles indicate whether a student will be a National Merit Semifinalist?
No! Approximately 1% of test takers qualify as Semifinalists each year, so it is tempting to view a 99th percentile score as indicating a high enough score — especially now that College Board provides students with percentiles by state. There are any number of flaws that rule out using percentiles as a quick way of determining National Merit status.
- Percentiles are based on section scores or total score, not Selection Index
- Percentiles are rounded. There is a large difference, from a National Merit perspective, between the top 0.51% and the top 1.49%
- Percentiles reveal the percentage of students at or below a certain score, but the “at” part is important when NMSC is determining cutoffs.
- The number of Semifinalists is based on the number of high school graduates in a state, not the number of PSAT takers. Percentiles are based on PSAT takers. States have widely varying participation rates.
- Most definitive of all: Percentiles do not reflect the current year’s scores! They are based on the prior 3 years’ performance. They are set even before the test is given. And if you are going to use prior history, why not use the record of prior National Merit cutoffs rather than the highly suspect percentiles?
Entry requirements for National Merit versus qualifying for National Merit.
Your PSAT/NMSQT score report tells you whether you meet the eligibility requirements for the NMSP. In general, juniors taking the October PSAT are eligible. If you have an asterisk next to your Selection Index, it means that your answers to the entrance questions have made you ineligible. Your answers are conveniently noted on your score report. If you think there is an error, you will also find instructions on how to contact NMSC. Meeting the eligibility requirements simply means that your score will be considered. Approximately 1.4 million students enter the competition each year. Only about 55,000 students will be named as Commended Students, Semifinalists, Finalists, or Scholars. See National Merit Explained for more information.

Hello!
Thank you for all you do! This is an incredible amount of information! I see that you’re expecting a 214 cutoff with a range of 213-217 for Wisconsin. My son got a 214. Based on the commended score coming in at 208, do you expect to change projected range for Wisconsin based on the updated commended score? Thanks so much!
Wisco,
I’m working on a full update. I expect to update my Most Likely to 214 for WI. When the Commended level is below 210, we’ve only seen 1 year where the Semifinalist cutoff has gone to 215. This year looks a lot like the Class of 2025, where Wisconsin was at…214.
Greetings!
Appreciate all the interesting analysis that you have provided. I was wondering what your thoughts are on the cutoff for Oklahoma would be?
Your great work and analysis to-date inspired me to do a simple thought experiment and would like to get your feedback/critique of the process.
Given the national numbers from your post, I was looking to see what other years had similar patterns based on the ratios (e.g. ERW/Math, Math to Total, etc.). Looking backing on available data, it looks like 2019 was the closest that I was able to find so I used this as a reference for comparison. I then looked at the specific number of scorers above 700 for ERW & Math in Oklahoma going back to 2019. If you look at this number, there appears to be a correlation between this and the cutoff index score (excluding the covid year) where the total number of ERW+Math scorers above 590 correlated to an index score of 211 and higher. To estimate what the total number of scorers for 2027, I had to look at the correlation between the number of OK scorers that scored above 1400 to the national scorers above 1400 and there appears to be a correlation here. Based on this, the estimated number of scorers in OK above 1400 is around 220. Once I had this number I can look to estimate what the total number of ERW+Math scorers above 700 in OK. I did this by looking at ratio of scorers above 1400 to total scorers of ERW+Math above 700 from 2019 (note earlier that this year had similar scoring pattern at 2027) and applied this ratio to 2027. This resulted in an estimated 550 ERW+Math scorers above 700 for OK in 2027. Based on this, it looks to put OK at 210 for the cutoff.
I think that I may have gone to far down the rabbit’s hole.
David,
Welcome to the rabbit hole! I’m always happy to have company. One danger in looking exclusively at OK when coming up with a correlation is that we are likely to overfit. We’ve got lots of variables to choose from and only so many years. I took the data for each of the 50 states for RW, M, and Total Scores and couldn’t come up with a pattern that satisfied me. You say that you took the number of scorers above 700. At least in my source — the SAT Suite of Assessment Annual Reports — we only get an integer % of scorers in each band. We can multiply that times the number of test takers, but it’s a loose estimate. 4% can mean anything from 3.5001% to 4.4999%. I’d also wonder about 2019 being the best analogue, since that was a year with far more high scorers. If you were using the 2019 SAT Annual Report, did you account for the fact that it contains 11th grade PSAT data for the class of 2020?
I look at a lot of metrics, but in the simplest terms, I see 2017, 2021, and 2025 as the best analogues, nationally. I’d be unsurprised to see a cutoff of 211, 212, or 213 (I did choose 212 as my Most Likely). If we look at the last10 years, OK has only been at 210 or lower twice, and one of those was the COVID year. It’s possible, I just wasn’t able to come around to it being Most Likely.
Greetings!
You’re expecting a 223 cutoff with a range of 220-224 for California. My son got a 222. Based on the commended score being a 208, do you expect to change the projected cutoff for California based on the updated commended score? Thanks so much!
Kiyon,
Just updated! My Most Likely is now 221 after reevaluating everything with the new information and a fresh eye. The key is what happened to RW scores at the highest end of the range. If, as I suspect, there has been a significant decrease in 730-760 scores, then your son should be set with a 222. If the highest RW scores stay at an elevated level (meaning most of the drop was in 700-720 scores), then a 223 cutoff is still possible.
Thank you for all your great work. I see that the expected cutoff for OH is 218 (range 215-220. My son got 216. What are the chances of getting him into the semi finalist pool?
OH-Jun,
I just had a chance to update all of my estimates and have dropped the Most Likely to 217 for Ohio. I’d put the odds of a 216 qualifying as 30-40%.
Thank you for your commitment to maintaining this blog and replying to endless comments year over year. Since no one in my state appears to have asked for this cycle, I have a 223 in Washington State and am wondering about qualification odds. I am above the “Most Likely” mark (222) but below the top of the “Est. Range” (220-224) and below last year’s WA state cutoff (224). I am feeling stressed waiting on an uncertain bubble and hoped you could alleviate some of that.
Thank you!
Annie,
I don’t know that I can completely relieve your anxiety, but let me do my best. It’s crucial to understand how unusual last year’s scores were. There had never been a 224 in any state, except Maryland’s during COVID when the state canceled all PSATs and students applied via alternate entry. The crucial table is the number of higher scorers each year. The number of 700-760 RW and M scores took off. This year, the RW scores, in particular, fell back to Earth. They’re lower than they were even with the Class of 2025. And RW scores have double the impact on the Selection Index. There is little chance that we will see the high cutoffs we saw last year. Washington’s previous high was 222, and my hypothetical money is on it going no higher. You’re already higher than that. I try to allow for being wrong, so I do include 223 and 224 in my estimated range. Your score is higher than in every other year in Washington’s history, we have extremely strong evidence that cutoffs will be going down. I am not going to be as wrong as a 224.
Thank you for the rich data analysis; I have been following your blog for years. What percentage of total test takers do you think get a 1520? My child did and wanted to get a perspective on how many test takers score that typically.
Marissa,
It’s been many years since College Board has reported actual numbers for the SAT or PSAT (percentiles only, now). My estimate is 1,000 students per year, but it’s only an estimate. Needless to say, it’s a very good score! Congratulations to your student.
Hello Art,
Writing to see how the timing of learning NMSF lines up with college applications. I believe my daughter has a good chance of being a semifinalist in Wisconsin (219). Should she wait until she learns this for sure until she sends out applications (assuming this will be a nice award to include in the application). I also assume the announcement on who moves from semifinalist to finalist is usually past the date when most applications are filled out.
Thanks for the insight,
Tom
Tom,
For most application deadlines, the mid-September NMSF announcement comes in plenty of time. In cases where an earlier submission is important, I’d recommend discussing the situation with your counselor. Updating your application with the new information should be possible. The late-January or early-February Finalist announcement is usually to late for RD applications, but, again, you can pass the new information along.