
PART I: Unexpected, Unexplained Score Drops
Critics of standardized tests correctly assert that even the best built tests are imperfect and incomplete. However, high stakes tests like the SAT and ACT have remained credible because they have traditionally produced consistent results. That is, because very large testing pools don’t change much from one year to the next, a well constructed test should yield fairly similar results each time it is offered. The exact level of difficulty of any given test form will vary slightly, but that’s where scaling is used to bring scores into alignment.
And that is where something seemed amiss, when 2019 PSAT scores were released last month.
College counselors across the country noticed significant drops and were understandably concerned that their current juniors and sophomores underperformed on this year’s exam. So we looked into the figures provided by College Board to the schools, and found the following:
- The number of juniors scoring 1400+ dropped 30%, from 71,000 to fewer than 50,000.
- The number of sophomores scoring 1400+ dropped 36%.
- High-performing students scored as much as 30 points lower than in previous years. The student who would have scored 1400 last year was more likely to score 1370 this year.
- There were far fewer students in the typical National Merit ranges. We now project that National Merit Semifinalist cutoffs will decline 1–4 points.
- The primary PSAT form (Wednesday, October 16th, taken by 86% of students) may have been the most skewed, resulting in inequities based on when students tested.
The unexplained results affected more than just the top scorers:
- Students scoring 1200+ dropped by 15% for juniors and 21% for sophomores.
- The average PSAT scores for all 1.7 million juniors dropped by 10 points, an unusual change considering that the average usually moves by 1–2 points on a well-constructed exam with a stable group of testers.
- The drop in Math scores was almost twice that of the drop in Evidence-based Reading and Writing (ERW) scores. Even the number of students meeting the baseline Math benchmark for college-readiness dropped 10% this year.
Unless there was a national math crisis that put high-scoring students in the classes of 2021 and 2022 a half-year behind their class of 2020 peers, something appears to have gone wrong with the PSAT. Until an explanation is provided, we’ll assume this was a test construction problem and not a change in student achievement. This could have ramifications for how students and schools interpret and use PSAT scores and on the amount of trust College Board is given when creating and reporting on PSATs and SATs.
Compass has divided the rest of this report into sections so that readers can find the parts most relevant to their concerns:
PART II: How conclusions were drawn
PART III: Why discrepancies matter
PART IV: The need for an independent auditor
PART V: An FAQ for parents, students, and counselors
PART VI: A deeper dive into the data
PART II: How conclusions were drawn
College Board makes almost no information about PSAT results public and provides no self-assessment. This is our attempt to partially fill that void.
The PSAT is not a single exam. A set of forms is used for different dates and for different situations. Because the primary form on October 16th was the dominant exam—taken by 86% of students—our analysis is most applicable to that exam, 2019 PSAT Form A. We believe that much of the problem lies with this form. We hope to gather more data for other forms such as the October 19th and October 30th administrations.
Counselors can contact the author at art@compassprep.com for more details about how to help get more useful comparisons for themselves and their peers.
Disappearing High Scorers
Twenty thousand top scorers don’t simply disappear. This should have been a red flag that something had gone wrong. Instead, this information was buried in a report available only via a portal for college counselors.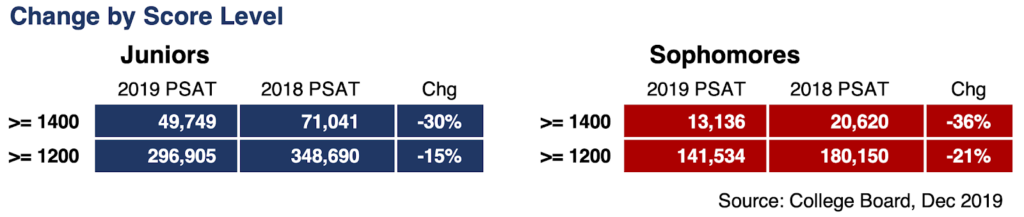 To push 20,000 students below 1400, scores would have been off by an estimated 20–30 points. A curve that normally aligns year to year has been deformed.
Unusual Changes in Average Scores
When testing similar groups of students, a well-constructed exam produces similar distributions of scores. At the very least, it allows us to trust that a 1200 on one exam means the same as a 1200 on another. That trust is what keeps these tests alive. With 3.5 million students taking the PSAT/NMSQT each fall, results should be stable. In 2019, they were not.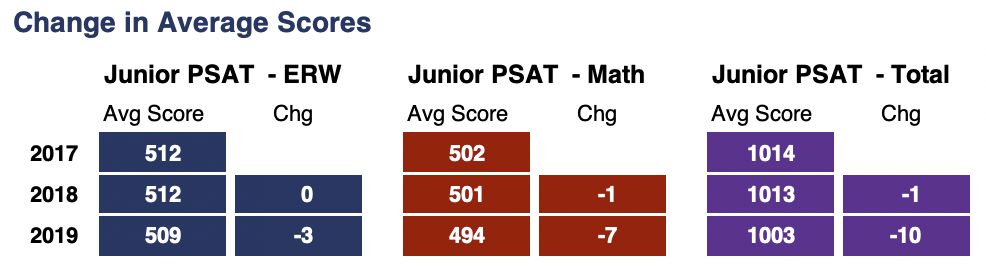 These declines were well outside the norm and should have been another indication that something was wrong. Achievement changes that large rarely happen in a single year. The last time average SAT scores declined by 10 points was in 1975.
Changes in average scores are less volatile than score changes at a specific portion of the scale. For example, unchanged scores for students scoring below 1000 offset discrepancies at the high end. Several forms are averaged together when computing mean scores. The estimated decline of 30 points among high-scoring students on October 16th test was almost triple that observed across all PSAT takers.
PART III: Why discrepancies matter
PSAT scores are used in a number of situations where accuracy matters:
- The PSAT determines more than $100 million in financial aid through National Merit and other college scholarships.
- College Board urges schools to use the PSAT to place students into AP classes.
- The PSAT provides an important comparison to students’ performance on the SAT or ACT.
- The PSAT is used by schools, districts, and states to track student performance over time.
Scoring anomalies also call into question College Board’s ability to accurately construct PSATs and SATs or to objectively critique the tests’ performance. No third party provides oversight of test integrity. (It’s perhaps ironic that a test prep company is trying to do that.) College Board and ACT grade their own work and have a habit of making erasures after time is called. We are concerned that the same discrepancies can crop up on the SAT, but that they are easier for College Board to keep hidden, especially since it does not publicly release the data.
How will this impact National Merit cutoffs?
When aligning their class of 2021 students to the class of 2020 Semifinalist cutoffs, many counselors will have a sense of alarm. Our analysis, however, indicates that most state cutoffs will decline. It is more difficult to predict where that dividing line will occur. Compass maintains the most thorough reporting of National Merit results and analysis here. Our current forecast is that most cutoffs will decline from 1 to 4 points. Even large states that typically move no more than a point from year to year may see significant drops. The Commended cutoff could move as much as 4 points from 212 to 208, although 209 is Compass’s current estimate. [This is another place counselors can help through crowdsourcing of data. Contact the author for details.]
Does this mean that my school will see far fewer National Merit Semifinalists?
Possibly not. Ultimately, 16,000 students will be named Semifinalists, just as they were in last year’s class. If each test code—and we know of at least 8 of them for this year’s PSAT—had performed similarly, then one test date versus another wouldn’t matter. We believe, however, that the forms did not perform equivalently. We are particularly concerned that October 16th test takers were disadvantaged. Conversely, students who took one of the other forms may have a higher chance of qualifying thanks to a lower bar. The discrepancies also impacted ERW and Math scores unequally. This may have consequences for the mix of National Merit Semifinalists given the way the Selection Index is calculated. Score anomalies are potentially damaging when hard cutoffs are used to make decisions or where scores are used programmatically.
Why are there different forms at all?
For test security, exams given on different dates should be unique. Although 86% of students took Form A on October 16th, another 7% took Form H on October 30th. We estimate that 5–6% of students took the Saturday October 19th exam. (College Board keeps that exam almost entirely under wraps. Students are not given back their booklets or access to questions after the exam. No scaling is reported.) The remaining students took a form used for those with special accommodations or were in a group of schools who took one of the top secret forms used by College Board to help create, test, and scale future exams.
Top secret sounds ominous. What does that mean?
Even on October 16th, not all students took the same exam. On many PSAT and SAT administration dates, secondary forms are used for a variety of test development and monitoring purposes. Typically, a school is expected to distribute these exams in a prescribed fashion that allows—when repeated over a number of schools—College Board to gather what is known as “equivalent group” data useful for scaling new tests. The significant downside from a student’s perspective is that these secondary forms are not released. Even test administrators must go through special training to use them. Other than scores, these students and schools receive no useful feedback, which largely defeats the intended purpose of the PSAT. We know of at least 6 secondary forms (Forms B through G) used on October 16th. We do not have sufficient data to report these results, but our preliminary comparison of the forms is not favorable. It appears that some forms resulted in higher overall scores than did others.
PART IV: The need for an independent auditor
Why has College Board remained silent?
There are multiple places where alarms could and should have been sounded and scoring deficiencies addressed. Tens of thousands of high scoring students “disappearing” should have set lights flashing at College Board. The unusual drop in average scores should have provoked a reevaluation of scaling. If—as we suspect—different forms produced different results, interventions could have been made. Are there proper checks and balances in place? Are auditors not speaking up? Are they speaking up but not being heard by management? Are there any auditors at all?
Beware of false claims
In the past, College Board has shifted attention from its own mistakes by wrapping them in misleading narratives. On the 2016 PSAT, scores for juniors improved by 9 points and were up across all demographics. College Board explained this as a win:
“It is both rare and encouraging to see this kind of positive improvement across the board. I’m inspired by the swift embrace of the PSAT-related assessments, and even more by the progress we are seeing,” — Cyndie Schmeiser, senior advisor to the president, the College Board.
That account 4 years ago suggested that millions of students improved their performance concurrently. The simpler reading was that the 2015 PSAT—the first edition of the completely overhauled exam administered a year prior—was a lemon. It appears the same failure to produce consistency from exam to exam has reoccured. We hope, with this report, to preclude any false narratives. This is not about students losing the ability to do algebra or read critically. This is more likely about a miscalculation of scores.
Are problems limited to the PSAT, or do they also apply to the SAT?
We fear the same sort of miscalculations arise on the SAT, although they are better obscured by the high number of dates and forms used throughout the year. The PSAT provides a useful Petri dish because entire cohorts take the test at the same time each year. Almost 3 million students took the October 16th administration, 5 to 10 times the number taking the typical SAT form. Moreover, the cohort of PSAT takers is stable from year to year. On the SAT, on the other hand, the normal variation in student behavior can mask test construction problems. College Board should have a transparent audit process and report card for both the PSAT and SAT to demonstrate its commitment to accurate reporting of student scores. Obfuscation is incompatible with its mission.
PART V: An FAQ for parents, students, and counselors
Compass has prepared this FAQ to further explain how schools and students can interpret the 2019 PSAT results.
Don’t scores fluctuate? Isn’t the standard error of measurement more than 20–30 points?
The overall drop on PSAT scores should not be confused with the standard error of measurement (SEM) that is inherent to any standardized test. SEM is an estimate of how much an individual student’s score may vary from form to form. Rather than view a 1340 as a completely accurate measure of ability, students are encouraged to think of a range of 1300–1380, reflecting the 40 point SEM for total scores on the PSAT.
SEM would be like a single golfer who averages 200-yard drives hitting the ball 190 yards some times and 210 yards other times. In testing jargon, there is a difference between his observed drives and his true driving ability. The 2019 PSAT was like a bad batch of golf balls leaving nearly every drive about 30 yards short. On the 2019 PSAT, lower scores impacted hundreds of thousands of students. The standard error of measurement still exists—it’s just now layered on top of a flawed scale. A shift of this magnitude would not happen with a well-designed exam.
Are percentiles still correct? Don’t they reflect actual performance?
No and no. The User Percentiles reported by College Board are not at all related to the scores received on the 2019 PSAT/NMSQT. Instead, the figures are aggregates from the 2016, 2017, and 2018 administrations. The User Percentiles for above average scores, therefore, under-report students’ actual relative standing on the 2019 exam. Once more, we can’t express this exactly without more data from College Board. Also, percentiles are never differentiated by form.
A rough rule-of-thumb for October 16th PSAT takers at 1200 and above would be to add 20–30 points to the total score and use the percentile tables from PSAT/NMSQT Understanding Scores 2019. |
Should high schools treat scores differently?
First, schools should not be surprised to find that they have fewer high scorers this year. In our audit, we found a decrease of almost 40% in students scoring 680 or higher on the Math PSAT. The charts we provide in the Deep Data Dive section below give a rough sense of how things may have shifted. We will update our guidance if we are able to gather additional information. We now expect that most—if not all—states will see lower National Merit Semifinalist cutoffs. Based on our analysis, many states will see cutoffs 2–3 points lower than those seen for the class of 2020.
As a rule of thumb, schools offering the October 16th exam may want to add 20 points to Math scores above 600 and 10 points to ERW scores above 600 to bring them into closer agreement with previous years’ results.
Does this change how a student should choose between the SAT and ACT?
In most cases, the lower PSAT scores will not change a student’s decision. Any given test administration produces only an approximation of a student’s “true score.” Many factors come into play when deciding between the SAT and ACT. We would recommend that, when using a tool such as Compass’s PSAT/ACT Score Comparison or Concordance Tool, that October 16th students add 20–30 points to their scores if they are at a 1200 or higher. Unfortunately, we don’t have enough data to make a recommendation for students who took other administrations. A student who feels the PSAT results are unreliable should take an official practice SAT.
If the 2018 and 2019 PSATs are so different, could it be the 2018 test that was off?
The results from the 2018 PSAT were in line with those seen in 2016 and 2017. This seems to be a problem with the 2019 PSAT.
What lessons can students learn?
The job of College Board (and ACT) is to provide a fair testing environment by using parallel forms. One exam should not give students an advantage over students taking another. Unfortunately, this goal is not always achieved. While students have no way of predicting when a “bad” test will be offered, they can diminish its impact by spreading their risk. Relying on a single exam is poor planning. A student may perform poorly because of lack of sleep, a noisy room, an untrained proctor, an odd question or passage that trips up timing, a mismatch of skills studied and the problems appearing on that form, and many other reasons. The 2019 PSAT shows that students can’t even necessarily trust that the exams themselves are accurately scaled. An effective test plan must allow for the unexpected.
An alternative plan is to look more seriously at test optional or test flexible colleges. It’s unfortunate that students should plan for more testing to compensate for the vagaries of the exams.
Could the change be intentional? Were scores getting too high?
College Board has not announced any adjustments to the PSAT scale. Changing a scale without a specific rationale and without notice would be unprecedented. College Board would have little interest in lowering scores. We hope that College Board will clarify what went wrong with this year’s exam, but we don’t see any validity to this particular conspiracy theory.
Is any of this related to the introduction of experimental sections on the PSAT?
At schools not willing to pay additional fees, students were given “experimental” sections that are typically used to help scale and develop future tests. The use of these experimental sections may be evidence that College Board is taking the production and scaling of the PSAT more seriously. Any added diligence has not yet shown up in PSAT quality. The experimental sections are unlikely to have caused the scoring problem.
So what did cause the scoring mistake?
Only College Board can properly answer this question, and they declined to respond to this report. The most likely cause is poor sampling when developing the exam’s scale. If the sample group differed in unexpected ways from the reference group—differing in expected ways can be modeled—then the scale would have been incorrect. This is more likely to happen at the high end of the scale, where there are fewer test takers and fewer students in a sample group. Mistakes such as this one would spur most organizations to re-examine their procedures. Organizations can use a “red team” to intentionally probe for weaknesses or errors. College Board should have high standards of accuracy or at least be candid with students, schools, and colleges about what standards it does maintain.
PART VI: A deeper dive into the data
Is there another explanation?
When analyzing data, it is important to consider alternate hypotheses. Scores sometimes move lower when the pool of test takers shifts significantly. For example, if several high-scoring states abandoned the PSAT, then the numbers might have been skewed. There is no evidence that this happened, and the number of PSAT test takers is little changed. The problems also seem to have affected both the sophomore and junior classes, which makes an alternate explanation far less credible.
To further rule out the possibility that overall test taker achievement explains the score drops, we worked with a set of schools to compile data comparing class performance on the 2018 and 2019 PSATs. We observed the same issues with scores at every school. For those offering the October 16th exam, there was a 46% drop in the number of students scoring at or above 1400. We did not gather enough data from the October 19th or the October 30th dates. [Compass’s data does not come from our own students, and the effects of test prep should be irrelevant to the results.]
Was this a result of harsh scales students have complained about?
What first drew our attention to the PSAT scores were complaints from students about harsh scales on this year’s exam. Indeed, on the Reading and Writing tests, scores dropped precipitously from only 1 or 2 mistakes. The most significant scoring problems, though, were on on the Math section—the only test, as it were, that had a “typical” scale.
A harsh scale exists to offset an easier test. The scaling done on the PSAT is different from what a classroom teacher might do to determine that a certain percentage of students will receive As, a certain percentage will receive Bs, and so on. PSAT scaling is designed to take into account the small differences in difficulty between test forms. We have found that the Reading and Writing & Language tests really were easier than is typical.
How do we know a test was easier?
One way of judging the difficulty of a test is to look at how many students achieved a perfect score. Zero wrong is the only score that can’t be impacted by a scale because, by design, a perfect test must receive the highest available scaled score. On an easier test form, we should see more students achieving a perfect score. While College Board doesn’t release this level of detail, our sample of school data shows the expected result—the 2019 PSAT was in fact an easier test.
Perfect Reading Scores Increased 703%
Perfect Writing Scores increased 61%
Perfect Math Scores Increased 160%
However, when we look at scores below perfect, the 2018 and 2019 tests come into closer alignment on the Reading test and the Writing & Language test. We expect this behavior if the test is properly scaled.
Scores on Reading and Writing are reported on a scale of 8–38. They are added together and multiplied by 10 to produce an ERW score. For example, a 35 Reading and 34 Writing produces a 690 ERW score. For Math scores, we use the more familiar 160–760 scaled score range.
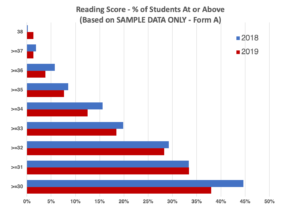
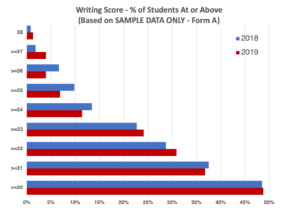
On Reading and Writing, there are some differences between 2018 and 2019 results, but nothing like what we see on the Math chart below. For example, the chart shows that almost twice as many students earned a 660 or higher on the 2018 PSAT than did on the the 2019 PSAT.
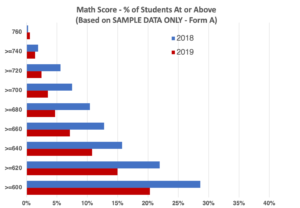
These sample school data (exclusively from the October 16th Form A) are in line with the overall performance results reported by College Board—while none of the three subjects are perfectly aligned, the discrepancies are far more prominent on Math than on Evidence-based Reading and Writing.
Compass fully strives to report data honestly. If this report includes any errors, we will be quick to admit them and fix them. This is why we granted College Board a preview of this report. Our goal is to give complete and accurate information and analysis to everyone who has a vested interest in high stakes college admission testing.

This analysis is brilliant and necessary. Thank you for sharing your remarkable research and insight.
Thank you, Mike.
So does this mean I should be good with a 222 (-1R -1M) in CA?
J,
Yes, you should be good for NMSF. Congratulations!
Is a 219 (-2 R -2 M) National Merit in Michigan for Class of 2021?
V,
I think a 219 has a very high likelihood of qualifying in Michigan. I doubt that we’ll see even a single large state move higher this year.
I am happy to see that the trend wasn’t just my imagination! Still, I attributed at least some of the math decline in the very radical change to math curriculum created by Common Core. Our local Common Core implementation, for example, has created a 3-year integrated math model for algebra, algebra II, trigonometry, and geometry. Many of my local students–especially those who didn’t accelerate through the integrated levels–showed uncharacteristically low scores and reported being completely unfamiliar with some of the content on the test. I can’t understand how a test given to a student that is 2 years through a 3-year integrated curriculum is ever going to align with students who go through the curriculum in the traditional sequence.
In theory, these students will “catch up” in their SAT scores in the coming year. We shall see. Thanks for this excellent analysis.
Kelly,
It’s entirely possible that your local Common Core has contributed to weak PSAT scores. I haven’t noticed that effect. David Coleman, the CEO of College Board, played an important role in the implementation of Common Core standards prior to his time at College Board, so we’ve also heard complaints from schools who have stayed away from Common Core.
It’s far too late be concerned about whether the College Board’s future SATs might be infected by the “incongruity disease” that manifested itself with the October 2019 PSAT. In fact, the contagion appears to have been spread in the other direction: See our blogs titled “Is Alice in Wonderland’s Mad Hatter in Charge of SAT Scoring Curves?”, which discussed the crazy scores on the August 2019 SAT, and “Wacky Scores on the June 2018 SAT,” which discussed the strange scores on that test.
Dan,
Yes, we’ve written about the same issues with scales, scores, and gaps on both the SAT and PSAT. The problem is that College Board has been able to hide behind the “scaling adjusts for difficulty” excuse. Even widely differing scales can be correct under the right circumstances. Even completely congruous scales can be incorrect under the wrong circumstances. What we were able to show here is that the end results — not just the scales — were definitively wrong.
My son was so dissapointed that he didn’t score as high as his sister a few years ago. With the 4 point adjustment, they tied. I coach Academic Decathlon and most of my team are Juniors. They were discouraged across the board by their scores. It all makes sense now.
Michelle,
Glad I could bring some peace to your household and comfort to the Academic Decathlon team. It was a frustrating test all around.
Great analysis Mr.Sawyer and thank you for the information. The test seems to be a total mess and college board did it again.
My Son is a Junior and he scored a perfect ACT score (36), PSAT score (1500) as Sophomore but got only 1480 in the Oct 16, 2019 test. Initially he was upset but then realized that not only he but everyone got a lot less than they actually got as Sophomores.
Thank you, DJ. The PSAT is, indeed, a mess. Congratulations to your son on his ACT score.
Hi Art,
My child received a 1410 or 99% percentile and scored 208. Do you know an idea what the commended score may be? When would this get published?
G,
The Commended score will go down this year. I expect it to fall at least 2-3 points to 209 or 210. There is a possibility that a 208 will be Commended. NMSC does not publish the Commended cutoff, but it will become known in April when the organization begins contacting schools to gather additional information about students.
I have several questions. First were there different forms of the October 16, 2019, PSAT/NMSQT? And did anyone check the answers in math?
If there was only one form, then the lower scores on the Math/No Calculator Section might be due to wrong answers on the key.
I am a Math Interventionist and was asked to look at a student’s scores to see where the student’s problems might be. Upon checking his answers by comparing them to the questions on a copy of the Math/ No Calculator section of the Test(green on the cover dated October 16, 2019), I began to find mistakes in the key. I found so many that I began to doubt if it was the correct test key, but when I looked at the answers, many of the ones the key said were correct, were the wrong answers many students would get by making common mistakes. There were so many mistakes that I asked a colleague to take the test without giving him the answer key. His answers agreed with mine. So is there a problem here? If there is only one form, I believe there is.
Ruth,
I have not gone through it personally, but errors are usually spotted quickly in the primary form [Compass had an SAT question invalidated last year.] It sounds like the student may have taken one of the non-standard forms — probably B – G. Your school may have been a pilot school. Many of the questions on these non-standard forms will overlap with those on the standard form, but unique questions are mixed in. The non-standard forms are not returned to students. Most students have access to the questions they took via the PSAT portal, if this student does not, it would be proof that the student took a non-standard form. The key used by College Board for Form A can be found here: https://collegereadiness.collegeboard.org/pdf/psat-nmsqt-understanding-scores.pdf.
We had an experience at our high school that on the math section no calculator, the last three questions that the student had to write in, and were given a few different options for how to do so, the answers in number form. A student put in 7.5 in the four answer boxes for number 15, leaving a blank space at the end, got nervous she entered it in wrong so she erased it, moved the 7.5 over so now there was an erased 7 in the 1st box, but the scanner picked it up and she got the question marked wrong even though I being the test coordinator looked at it specifically and told her she had erased it sufficiently. She did this for these three questions and got scored wrong for all three even thought she had the correct answer. We have requested College Board to re-score her answer sheet for those three questions, 15, 16 and 17 and they refuse to do so after several attempts! She had a perfect score on the math with calculator and had a perfect score on the no calculator section until these last three questions. I am not sure if this happened to anyone else but it is unfair for them to not re-score this student’s answer sheet.
Jennifer,
I have heard in other cases, as well, that College Board has no equivalent to SAT Score Verification for the PSAT. Despite the huge fees that come in for the PSAT, College Board continues to treat it with neglect. I am sorry to hear how this neglect impacted the student.
From your own sample data, in each section (R,W,M), the numbers of perfect scores in 2019 are actually more than 2018, and this worries me. To further proof your hypothesis, do you have any data comparing the distribution of the NM index scores above 220 between 2019 and 2018?
Z.H.,
The distribution is skewed significantly toward lower scores as soon as you move away from perfect scores. I did not publish the distributions, though, because they are based only on a sample.
Art,
Do you think 220 can make NMSF in TX this year?
James,
I think it’s more likely than not that TX’s cutoff will drop at least a point.
Thank you Mr. Sawyer for your detailed analysis and service to the student community. I got a good understanding of why PSAT 2019 Scores seemed so different after reading this report. My son got a 1510 as a sophomore on the PSAT 2018 and 1480 as a junior taking the test in 2019. His school usually has 40+ National Merit Semifinalists every year, but this year just an informal poll of the student scores locally at the school level, using the same cutoff as last year did not yield even 30. Of course the sample size in this case is small and it is just an approximate calculation, but the results follow what you described in your report. College board keeps things opaque for their benefit and completely agree on the need for a third party to monitor College Board, ACT etc. I am sure the same kind of errors are being made on SAT as well.
Sam,
Thank you for passing this along. It sounds like your school is seeing what most schools are seeing. Yes, it’s unfortunate that there is no oversight.
Hi Mr. Sawyer,
Is there any current data that shows how many perfect scores there were this year or anything that could show a polarization in upper-99th scores that could possibly increase semifinalist cutoffs? I got a 222 in IL so would like to know. Thanks!
M,
No, College Board doesn’t report the score distribution except in the broadest swaths. Our sample data and our modeling based on the swaths all point in the same direction. I am extremely confident that we will see fewer 222, 223, 224 scores this year. I can’t imagine a 222 not qualifying in IL. A 2-point jump higher in a large, high-scoring state is just not going to happen this year.
Art,
Thank you this information! This is very helpful in understanding PSAT scores.
Do you know how many students in the US (actual number and/or percent) actually achieve a perfect test with no questions incorrect in recent years?
t,
I don’t know, because it is not published anywhere. I get asked this question periodically, so I did my own back-of-the-envelope calculations. My estimate would be that 0.1% of students achieve a perfect score (it’s rare these days for a student to be able to miss a single questions and achieve a 228). That would mean about 1700 perfect exams each year.
Just another data point to confirm your assessment above – My son got 1 question incorrect in Writing and got all questions correct in Reading and Math – his score is 226.
Thank you, GS!
We gave up on the idea of my daughter would qualify for NMSF 2021 since her PSAT score was 1480 (220 index score), but after reading this article, we have some hope.
Thanks again for your dedicated hard work providing great insights to help parents and students, especially understand more about SAT and PSAT.
TTB
TTB,
I’m glad that I could help. Best of luck to your daughter!
Any chance of an explanation and apology from the College Board?
EP,
No. We had a meeting scheduled with them, and they canceled after seeing a draft of our report. Their standard policy is to deny. They couldn’t do that in this case, so they opted for their plan B. Ignore.
Thank you for the insightful commentary. My daughter got the same score in ERW as a sophomore in 2018 and as a junior In 2019 (720) although she missed fewer than half as many questions in 2019. She was very demoralized, and your explanation has helped a great deal. When we looked at her score details we were surprised to see that she had actually done much better in 2019 but her score did not reflect the improvement.
Her SI is 215 in Louisiana , which was also last year’s cutoff. What do you think of her chances for NMSF? (I haven’t seen any comments on medium sized states).
Thanks!
LB,
It was definitely a test that demoralized many students. I’m glad that I could give more context to families.
I feel confident (maybe just shy of 100%) that your daughter will be a NMSF. Louisiana did see a cutoff of 217 the year before last. but I think the weakness of scores will mean that a 215 will qualify.
Thank you so much. It is so helpful to have your perspective and a voice of reason when dealing with this high-stakes testing insanity!
There was one change in this year’s PSAT, and I hate to even mention this because it’s really ugly to contemplate. This year, their were multiple versions of the standard form–the same questions, just the questions were jumbled a bit. Enough to make it harder to glance across, see what someone else answered, and reconsider your own. I literally feel sick to my stomach to think that this security measure could have such a dramatic impact. I don’t want to think that 30% of 1400+ kids in previous years were cheating. But it’s worth noting, and no one else seems to be aware of this. I only know because I sit down with each of my 100 students and go through their PSAT one on one, so it was quickly obvious that #14 was not always #14.
Amanda,
Your students were presumably at a school where College Board was testing experimental forms. These often involve combinations of ordering and the mixing in of new questions or whole sections. This was done on a limited basis and would not have impacted scores as a whole. Mixed question order was not the case on the widely taken form that I studied. My guess is that you will see different form codes with your students.
I don’t think my kids took a different form. I chatted with college board, and they would not confirm or deny, but they said that if they had started doing such a thing, they would have done it everywhere, not just at my school. My kid could access their full score report, with all the interactive stuff–what they answered, correct answer, explanation. Whatever version they had, their account pulled the questions up in that order.
Have you looked at multiple copies of the physical, newprint test? I think that’s about the only way to detect what I am talking about. They were all the standard form, but there was an additional letter on the “spine”.
For each form, there is a single answer key. Form A questions were asked in a particular order. Form B questions were asked in a particular order. Etc. That doesn’t mean that all of the questions were unique. Most students took Form A, which is the one I studied. I have seen a physical copy of Form A, but I admit that I have not seen multiple copies. What I have seen are the College Board statistics related to each question and their placement on the test. It’s interesting to consider that, as an experiment, College Board made multiple versions to see if a higher level of security made a difference. College Board rarely confirms anything related to test security or non-standard forms. This would have been done on a very limited basis.
Mr. Sawyer,
I just read your article. I scored 1450, 215 in Illinois . Perfect score in math. With the substantial decrease in high scores overall for 2019 exam , is there even a slight chance I could qualify in Illinois? I see that I would possibly qualify in many other states, but Illinois’ cutoff is much higher. Bummed since I went to school in Wisconsin (lower cutoff) until starting high school in Illinois.
Logan,
I try to be honest when a score falls outside of the Semifinalist range. I don’t think it’s possible that Illinois would see that much of a drop. Congratulations on your perfect score in Math, and I hope that translates into a great score on the SAT or ACT.
Hi! I know that estimates are not exact, but I’m curious as to what you predict the cutoff will be this year in Missouri. I had an index of 213, which was the lower of the estimated range for MO (213-217), do you predict a drop in this? Thanks.
Amy,
Four point drops are highly unusual, but this is a highly unusual year. I would not be surprised to see 1 or 2 state cutoffs move by that much.
I got a 219 in Texas. What are my chances of getting semifinalist?
Samuel,
You made it! I just posted the official numbers, and Texas came in at 219.