
Compass projects lower qualifying scores for the Class of 2027
The junior year PSAT is also the NMSQT — the National Merit Scholarship Qualifying Test. Each year, National Merit recognizes the top 57,000 test takers. In order to be included in that group, students need to be among the top 4% of the 1.4 million students who take the PSAT. Of that elite group, approximately 17,000 are recognized as Semifinalists for having the highest scores within their states. Semifinalists have the opportunity to continue in the program to become Finalists and, potentially, scholarship recipients. The remaining 40,000 students are recognized as Commended Students. More information can be found in our National Merit Explained post.
For the Class of 2027, the exact scores needed to qualify (“cutoffs”) will not be released until September 2026 (the Commended cutoff is likely to leak in April). In order to give students context for their test results, Compass has analyzed the scores from the October 2025 to produce estimates for the national Commended cutoff and the individual state cutoffs. We predict that the majority of state cutoffs will decline this year.
National Merit uses the Selection Index (SI), found on the PSAT score report, to rank students. The Selection Index can be calculated by doubling the Reading & Writing score (RW), adding the Math score (M), and dividing that sum by 10. For example, a student with a 720 RW and 700 M score has a Selection Index of 214 — (720 x 2 + 700)/10. The weighting of the index means that not all students with a 1420 Total Score have the same SI. A student with a 700 RW and 720 M has a Selection Index of 212. The highest SI a student can receive is 228 (760 RW and 760 M). Last year, the Commended cutoff was 210, and Semifinalist cutoffs ranged from 210 to 225 depending on the competitiveness of the state.
Why do we foresee lower cutoff scores?
College Board does not release any information about the distribution of Selection Indexes, but it does produce summaries of broad score ranges. The number of students in the 1400 – 1520 Total Score range has proved to be an excellent indicator of the Commended cutoff. The Class of 2027 saw 16% fewer top scores than did last year’s class. The 52,400 students at 1400 and above is closer to what we saw two years ago with the Class of 2025 and, going back further, similar to the results for the Classes of 2017 and 2021.
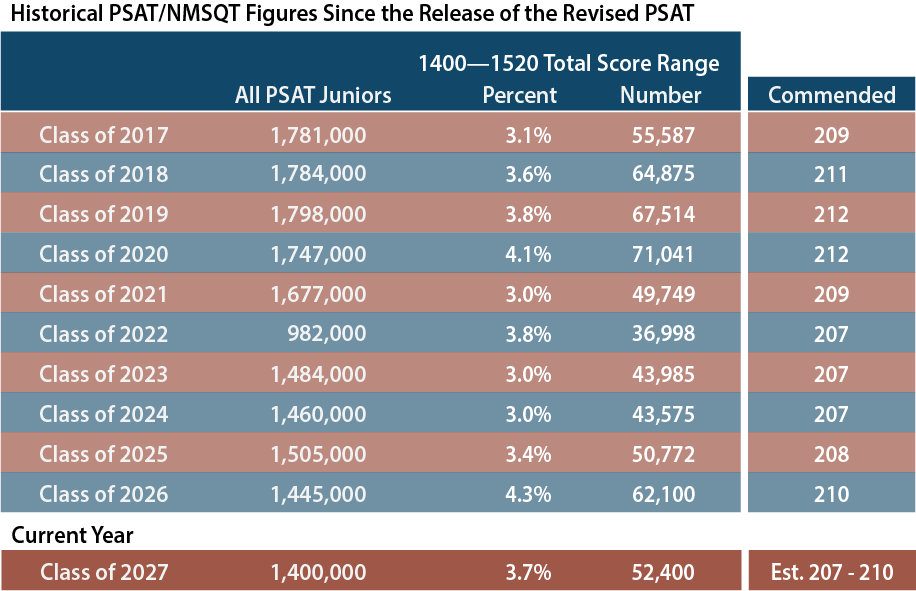
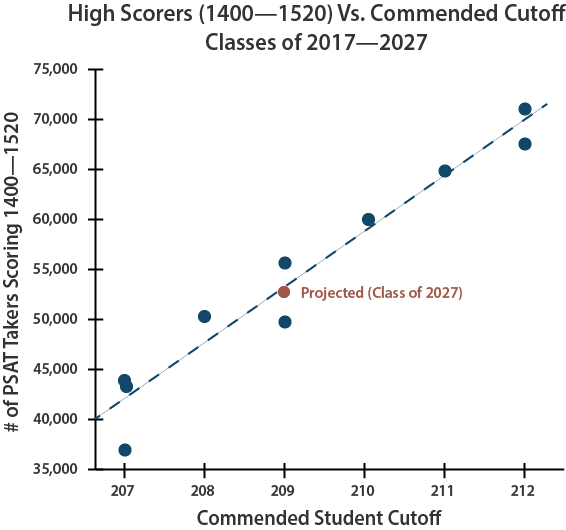
Most of the students who will qualify for National Merit recognition fall in the 1400 – 1520 band (or just outside it). With approximately 10,000 fewer students in the top band of scores this year, we expect the Commended level to drop to 208 or 209. The chart below shows the historical relationship between high scores and the Commended cutoff.
Explaining why last year’s cutoffs reached record levels
After examining this year’s numbers, we also have a better understanding of why Semifinalist cutoffs jumped to such extreme levels last year, and why it should not happen again. The 2024 PSAT saw an unprecedented 18% jump in the number of high Reading & Writing scores (700-760). The weighting of RW in the Selection Index magnified the impact of that change. The table below shows scores for the last three years and how results have fluctuated.

On the 2025 PSAT, the number of high RW scores dropped by 27%. In fact, the RW count for this year is even lower than it was two years ago. The decline in RW scores could even produce Selection Indexes lower than those in the Class of 2025 — at least in some states. The Commended cutoff may provide additional insight in the spring.
The ratio of 700+ M scores to 700+ RW scores reveals just how bizarre last year’s spike was. Traditionally, Math scores have higher distributions at the extremes. There are more very high Math scores on the PSAT and SAT, and there are more very low Math scores.
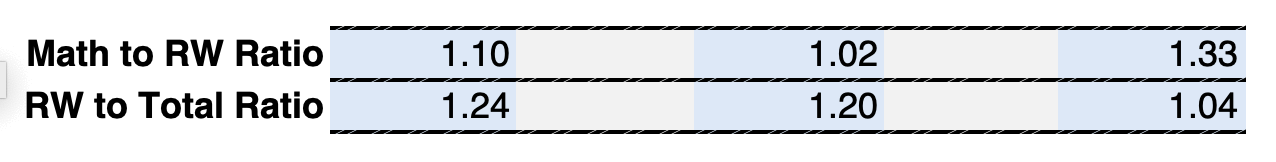
On the October 2024 PSAT, though, almost as many students scored 700-760 on RW as did on Math. The ratio of high Math scores to high RW scores was 1.02. This helps explain why some cutoffs went as high as 224 and 225 for the first time ever. Students achieved 750 and 760 RW scores in record numbers. In most years, there would be more students scoring 730 RW and 760 M (222 SI), for example, than scoring 760 RW and 730 M (225 SI). That was not true in the the Class of 2025, where there was a more equal distribution. It appears that scores for the Class of 2027 have returned to the traditional Math-heavy distribution. The ratio of high Math scores to high RW scores was 1.33 on the 2025 PSAT/NMSQT. For this reason, we don’t believe we will see a repeat of the 224 and 225 cutoffs seen last year.
Was last year a fluke, shift, or a trend?
The results from the Class of 2027 have answered one of the nagging questions from last year: Were the high cutoffs a fluke, shift, or trend? The answer appears to be fluke. More accurately, results could be labeled an error in test construction and scaling. There is no evidence that the Class of 2026 possessed special test-taking skills. As sophomores, that class performed in line with expectations on the 2023 PSAT. There is no evidence that the Class of 2027 has diminished skills. As sophomores, the class saw the same inflated scores as did the juniors on the 2024 PSAT. The best explanation is that College Board lost control of the scale. College Board dramatically shortened the PSAT when it switched from paper to digital. On the paper test, the Reading and Writing sections had 91 questions, and students were given 95 minutes. The RW on the digital PSAT is truncated to 54 questions over 64 minutes. And only 50 of the questions count toward a student’s score! A shorter exam means a less reliable exam. We saw the occasional wild ride on the paper PSAT, but the rides may get wilder and more frequent on the digital PSAT.
We anticipate the majority of state Semifinalist cutoffs to decline for the Class of 2027. Knowing this overall trend, however, doesn’t tell us which states will be in that majority or how much lower scores will go. The table below provides a Most Likely cutoff score, but the more useful information is the Estimated Range. Almost all cutoffs should fall within that range.
State | Class of 2027 (Most Likely) | Class of 2027 (Est. Range) | Class of 2026 (Actual) | Class of 2025 (Actual) | Class of 2024 (Actual) | Avg NMSFs |
|---|---|---|---|---|---|---|
| Alabama | 213 | 210 - 216 | 214 | 212 | 210 | 250 |
| Alaska | 214 | 210 - 216 | 215 | 214 | 209 | 35 |
| Arizona | 218 | 215 - 220 | 218 | 217 | 216 | 398 |
| Arkansas | 213 | 210 - 216 | 215 | 213 | 210 | 143 |
| California | 223 | 220 - 224 | 224 | 221 | 221 | 2,115 |
| Colorado | 218 | 216 - 221 | 219 | 218 | 216 | 286 |
| Connecticut | 222 | 220 - 223 | 223 | 221 | 221 | 175 |
| Delaware | 219 | 218 - 221 | 220 | 219 | 219 | 44 |
| Florida | 217 | 216 - 220 | 219 | 217 | 216 | 999 |
| Georgia | 219 | 217 - 221 | 220 | 218 | 217 | 602 |
| Hawaii | 218 | 215 - 220 | 219 | 217 | 217 | 62 |
| Idaho | 214 | 211 - 217 | 215 | 213 | 211 | 96 |
| Illinois | 220 | 218 - 222 | 222 | 220 | 219 | 704 |
| Indiana | 217 | 214 - 219 | 218 | 217 | 216 | 313 |
| Iowa | 213 | 211 - 216 | 214 | 212 | 210 | 145 |
| Kansas | 216 | 213 - 219 | 216 | 215 | 214 | 144 |
| Kentucky | 214 | 211 - 217 | 214 | 213 | 211 | 201 |
| Louisiana | 215 | 212 - 218 | 216 | 214 | 214 | 222 |
| Maine | 215 | 212 - 217 | 217 | 214 | 213 | 55 |
| Maryland | 223 | 221 - 225 | 224 | 222 | 221 | 308 |
| Massachusetts | 223 | 221 - 225 | 225 | 223 | 222 | 318 |
| Michigan | 219 | 216 - 220 | 220 | 218 | 217 | 485 |
| Minnesota | 218 | 216 - 220 | 219 | 217 | 216 | 279 |
| Mississippi | 213 | 210 - 215 | 213 | 212 | 209 | 155 |
| Missouri | 216 | 213 - 218 | 217 | 215 | 214 | 289 |
| Montana | 211 | 208 - 214 | 213 | 209 | 209 | 47 |
| Nebraska | 213 | 210 - 216 | 214 | 211 | 210 | 105 |
| Nevada | 214 | 211 - 217 | 214 | 214 | 211 | 168 |
| New Hampshire | 217 | 214 - 219 | 219 | 217 | 215 | 60 |
| New Jersey | 223 | 222 - 225 | 225 | 223 | 223 | 451 |
| New Mexico | 211 | 208 - 214 | 210 | 211 | 207 | 104 |
| New York | 221 | 219 - 223 | 223 | 220 | 220 | 1,012 |
| North Carolina | 219 | 216 - 221 | 220 | 218 | 217 | 510 |
| North Dakota | 210 | 207 - 212 | 210 | 210 | 207 | 30 |
| Ohio | 218 | 215 - 220 | 219 | 217 | 216 | 538 |
| Oklahoma | 212 | 208 - 214 | 212 | 211 | 208 | 204 |
| Oregon | 218 | 215 - 220 | 219 | 216 | 216 | 188 |
| Pennsylvania | 220 | 217 - 222 | 221 | 219 | 219 | 596 |
| Rhode Island | 217 | 214 - 220 | 219 | 217 | 215 | 47 |
| South Carolina | 214 | 210 - 217 | 215 | 214 | 209 | 236 |
| South Dakota | 210 | 207 - 213 | 211 | 208 | 209 | 42 |
| Tennessee | 218 | 215 - 219 | 219 | 217 | 217 | 319 |
| Texas | 221 | 218 - 222 | 222 | 219 | 219 | 1,623 |
| Utah | 212 | 210 - 216 | 213 | 211 | 209 | 196 |
| Vermont | 215 | 211 - 217 | 216 | 215 | 212 | 28 |
| Virginia | 222 | 220 - 224 | 224 | 222 | 219 | 437 |
| Washington | 222 | 220 - 224 | 224 | 222 | 220 | 348 |
| West Virginia | 209 | 207 - 212 | 210 | 209 | 207 | 64 |
| Wisconsin | 214 | 213 - 217 | 215 | 214 | 213 | 292 |
| Wyoming | 209 | 207 - 212 | 210 | 209 | 207 | 24 |
| District of Columbia | 223 | 222 - 225 | 225 | 223 | 223 | 36 |
| Territories | 209 | 207 - 211 | 210 | 208 | 207 | 39 |
| Outside US | 223 | 222 - 225 | 225 | 223 | 223 | 86 |
| Commended | 209 | 207 - 210 | 210 | 208 | 207 |
How cutoffs are determined
Qualifying scores (“cutoffs”) are not based on the total score for the PSAT (360-1520) but on the Selection Index, which is calculated by doubling the RW score, adding the Math score, and then dividing the sum by 10. The maximum Selection Index is 228. Students can find a historical set of cutoff data here or see how Semifinalist and Commended counts have changed state by state.
We estimate that the Semifinalist cutoffs will range from 209 to 223. Semifinalists are allocated by state, and cutoffs are calculated by state. If Florida is allocated 1,000 Semifinalists based on its population of high school graduates, then NMSC works down from a perfect 228 Selection Index until it gets as close as possible to that target. Last year, 1,008 students scored at or above the cutoff of 219. A cutoff of 220 would have produced too few Semifinalists. A cutoff of 218 would have gone over the allocation. Because score levels can get crowded, it is easy for cutoffs to move up or down a point even when there is minimal change in testing behavior or performance.
Why does each state have its own Semifinalist cutoff if the program is NATIONAL Merit?
This is always a hot button question. NMSC allocates the approximately 17,000 Semifinalists among states based on the number of high school graduates. That way, students across the nation are represented. It also means that there are very different qualifying standards from state to state. A Massachusetts student with a 220 might miss out on being a Semifinalist. If she lived 10 miles away in New Hampshire, she would qualify.
No Semifinalist cutoff can be lower than the national Commended level. Cutoffs for the District of Columbia and for U.S. students studying abroad are set at the highest state cutoff (typically New Jersey). The cutoff for students in U.S. territories and possessions falls at the Commended level each year. Boarding schools are grouped by region. The cutoff for a given region is the highest state cutoff within the region.
Change is always the theme
Over the last two decades, at least half of the state cutoffs have changed each year. In some years, as many as 49 states saw ups or downs, usually because of questionable test forms. In addition to last year’s exam, the PSATs from 2011 (Class of 2013), 2016 (Class of 2018), and 2019 stand out as problematic. The anomalous 2019 results could be traced back to a particularly mis-scaled form, which I wrote about at the time. The Class of 2014 also saw significant changes, but those were more of a bounce-back from the previous year. The question for the Class of 2027 is how much of a bounce-back will be seen this year.

Cutoffs are particularly bumpy in states with smaller pools of test takers and National Merit Semifinalists. Over the last dozen years, cutoffs in the 12 largest states have remain unchanged 36% of the time, while the cutoffs in the smallest states have remain unchanged only 1 time out of every 5. No large state’s cutoff has jumped by more than 3 points in a year, whereas 6-point changes have occurred in the pool of smaller states.

When are National Merit Semifinalists announced?
The lists of Semifinalists will not be distributed to high schools until the end of August 2026. With the exception of homeschoolers, students do not receive direct notification. NMSC asks that schools not share the results publicly until the end of the press embargo in mid-September, but schools are allowed to notify students privately before that date. NMSC does not send Commended Student letters to high schools until mid-September. Compass will keep students updated on developments as the dates approach.
Do state and national percentiles indicate whether a student will be a National Merit Semifinalist?
No! Approximately 1% of test takers qualify as Semifinalists each year, so it is tempting to view a 99th percentile score as indicating a high enough score — especially now that College Board provides students with percentiles by state. There are any number of flaws that rule out using percentiles as a quick way of determining National Merit status.
- Percentiles are based on section scores or total score, not Selection Index
- Percentiles are rounded. There is a large difference, from a National Merit perspective, between the top 0.51% and the top 1.49%
- Percentiles reveal the percentage of students at or below a certain score, but the “at” part is important when NMSC is determining cutoffs.
- The number of Semifinalists is based on the number of high school graduates in a state, not the number of PSAT takers. Percentiles are based on PSAT takers. States have widely varying participation rates.
- Most definitive of all: Percentiles do not reflect the current year’s scores! They are based on the prior 3 years’ performance. They are set even before the test is given. And if you are going to use prior history, why not use the record of prior National Merit cutoffs rather than the highly suspect percentiles?
Entry requirements for National Merit versus qualifying for National Merit.
Your PSAT/NMSQT score report tells you whether you meet the eligibility requirements for the NMSP. In general, juniors taking the October PSAT are eligible. If you have an asterisk next to your Selection Index, it means that your answers to the entrance questions have made you ineligible. Your answers are conveniently noted on your score report. If you think there is an error, you will also find instructions on how to contact NMSC. Meeting the eligibility requirements simply means that your score will be considered. Approximately 1.4 million students enter the competition each year. Only about 55,000 students will be named as Commended Students, Semifinalists, Finalists, or Scholars. See National Merit Explained for more information.

I have read through all the comments, so I apologize if this has already been asked. My daughter missed the PSAT due to medical reasons and applied for an alternate entry and took an SAT June 1, 2019 as a qualifying entry for NMSC for 2020 graduates. I am wondering how they convert the SAT scores into the PSAT format to see if they qualify as a NMS semi-finalist or commended scholar? This information doesn’t seem to exist anywhere.
Tania,
When computing a Selection Index from a PSAT score, you simply double the ERW score, add the Math score, and drop a zero. The only twist with the SAT is that scores go to 800 rather than 760. In order to be fair, NMSC will cap the ERW and Math scores at 760. So let me give you a couple of examples.
780 ERW / 720 M, Selection Index = 224 (76 x 2 + 72)
740 ERW / 740 M, Selection Index = 222 (74 x 2 + 74)
Hi Art,
I think I understand most of this process so far, but it’d be reassuring to hear your input directly. I scored a 1500(740+760)224 on my junior PSAT in Texas, meaning that I am almost certainly safe for semifinalist status. However, what brought me here was the information concerning “confirming scores” on the SAT/ACT. In the December following my junior PSAT, I scored a 1470(750Reading+720math) on an SAT which would put me at a 222 for the SAT index(which would have me safe, as the latest confirming score index cutoff I’ve seen is 209). At this point I was still under the impression that my confirming score should be higher than my PSAT score (because of the slightly larger scale of SAT) and so I took the May and June SAT, both scoring 1460(730+730, 219 on index). While I can’t really explain how my score lowered, I am asking if I should submit my highest initial index SAT score from December, despite it being the most dated? From what I gathered from your posts, my SAT score shouldn’t matter for my finalist chances as long as it’s above the “confirming score” threshold, correct? At one point in the comments you mentioned improving an already high SAT score to get a better a “concordant score”, what is that about? I’m really banking on getting national merit finalist in order to get my college paid for, so I am just trying to do everything I can to max out my chances(but I don’t want to take any more SAT’s if I’m already accomplished in that criteria). Thank you for all your insight Art!
Brett,
Congratulations, in advance, on making NMSF in Texas! NMSC will use your highest set of scores (not a superscore). It doesn’t matter if you send only December or you send all of your scores. As long as the test date falls in the right time period — and Dec does — the date itself doesn’t matter. Your 222 is well above the score needed to “confirm.” A higher score doesn’t help you reach the Finalist stage, because you’ve already checked off that box.
Don’t worry about concordant scores. While I don’t know the post you are referring to, it must have been one where I was talking about ACT versus SAT scores. A concordance is used to compare ACT and SAT scores. This is the first year that the ACT can serve as a confirming score, which is probably why concordance came up. It’s not relevant to your case because you took only the SAT.
Hi Art, I am a Class of 2020 student from NY with a SI of 222. I know NY had a high cutoff of 221 last year, and I’m unsure about my chances to become a semifinalist. Do you think I have a decent chance? Thanks!
Amanda,
I think you have a very good chance. NY generally comes in 1-2 points below the highest cutoffs, and I don’t think we’ll see a 2-point move this year.
Hi Art, I’m a Class of 2020 student from Kentucky with a SI of 218. My best friend also has a 218. What percentage chance do you think we have of becoming semi-finalists? 60%?? Thanks!
Hannah,
Hopefully we will know soon. Since College Board doesn’t release any state results prior to NMSF announcements, we can only look at national trends and historical data. I think we’ll see between 60-70% of states have cutoffs stay the same or go down this year. Let’s hope Kentucky is one of those states.
Do you have any insight on GA’s cutoff for this year? I am a C/O 2020 student with a 220, and I am curious on my chances.
Joe,
NMSC will send notifications to schools this week. They still use snail mail, and schools sometimes sit on the information until the press release date in September. We should know more by the middle of next week.
Hi Art,
What is the likelihood the cutoff for Florida falls one point? I got a 1440 on the PSAT (740 R+W, 700 M), which gives me an index of 218. I had heard some folks say that, due to Hurricane Michael forcing many in the north of the state to take the harder alternative test, scores may be lower overall and bring the cutoff down.
Jordan,
So far we just don’t know how the alternate test date will impact scores. The scale was crazy, but how that played out in terms of score distributions or the % of Florida impacted is just speculation. In a “typical” year, we’d see a state like Florida have about a 1 in 3 chance of dropping a point. This year may not be typical. My take is that you have about 2 weeks to find out for sure. No reason not to stay positive!
My daughter took has the PSAT 710ELA+740Math=1450 dated on 3/24/19. Can she and how does she join this? I am total new to this. That was her 10th grade PSAT. She is going to 11th grade in September.
Jasmine,
Only the October PSAT taken in junior year counts for National Merit. She will be automatically entered as long as she makes sure to properly fill out her registration information.
Hello Art.
In your April 7, 2019 update you state that you think roughly 40% of the state cutoffs for semifinalist status will increase this year. However, in your state table the 2020 most likely cutoffs are the same as the 2019 actual levels. Am I misreading your write-up?
Thanks very much.
Steve,
As I’ve pointed out elsewhere, the best estimates — in the absence of a strong indication of overall changes — are the previous year’s cutoffs. That’s different than saying that all of those are going to be correct. I know that they won’t be. I’d be surprised if more than 30-40% are correct. The key is that we have no way of knowing which of the 60-70% will be wrong and in which direction. So far, we haven’t seen from NHRP or from the Commended level, giant shifts that would make me think we are going to see a major trend up or down.
Great thanks for the clarifications Art !
Hi,
I’m a student in Arizona with a 220 SI score from the 2018 PSAT. What is the likelihood of the Arizona cutoff remaining at 220 or dropping below?
Raghav,
I estimate that about 1/3 of students will see higher cutoffs this year. We don’t have any specific information on Arizona yet.
We are in Illinois. My son has an index score of 222. A one point cushion. What do you think the likelihood of Illinois increasing to 223 is this year? I know for the last two years it has stayed at 221. A lot of anxiety being so close and waiting all this time. I think he should be good with a confirming ACT of 35, right?
Kim,
I think there is little chance that we’ll see a 2-point move in Illinois. Yes, the 35 will be high enough as a confirming score.
Do you think a 216 will qualify for Alabama this year?
Michael,
We should know more in the coming days. At this point, I can only go with what I have seen at the national level — roughly similar to last year’s class — and what that typically means at the state level — probably 30-35 states where last year’s cutoff will still qualify for NMSF.
Hello Art,
I received an index score of 220 in Pennsylvania, right on what you predicted to qualify as a national merit semi finalist. What are the roughly the chances that I become a semi finalist?
Ari,
Until we get more specific intel, I can only base chances on what we have seen in prior years. I estimate that 15-20 states will see higher cutoffs this year, so your odds are better than even.
Our daughter here in MA is hanging on tight hoping MA doesn’t jump to 224 this year. Historically, we have been 222 and 223 , but she is very nervous of a potential jump to 224 since her SI 223. Since MA is larger and is one of the 5 states tied for the highest cutoff, is it less likely to shift upward? Thanks
A R,
Jumping from 223 to 224 is a big deal because the number of students able to squeeze into the 224-228 range is quite small. Not even NJ hit that mark last year. It’s not out of the question, but I think your daughter has a good chance at 223.
When do you think you will get more information about the cutoffs?
John,
NMSC waited an extra week this year and only mailed announcements on Tuesday, 8/27. It will take a little while longer to start receiving a critical mass of updates.
Hi Art,
Thank you for the page and your support. We are homeschoolers in Virginia and looking at a 222. We understand that this is likely very near the cutoff for semi-finalist here. We appreciate what you are doing and will let you know when we hear anything.
Thank you, R. Hopefully you will hear something in the next few days!
In case anyone is following, as a parent few folks called NMSC and NMS said they are mailing out the announcements to schools today using bulk mail. So the awards and the official cutoffs should be available next week.
Thanks, Matt. I’ve updated the site with the latest information.
Art,
When should schools receive their information? Any word on Texas’ Selection Index Cutoff? My son is on the bubble for National Merit Semifinalist in Texas. He wants to submit an application for a school in Texas with a Rolling Admission in Texas and a very competitive Engineering Program. We were hoping to know by Labor Day Weekend so he could submit his application this weekend.
No word, yet. It turns out that NMSC sent announcements a week later than expected (8/27 was the mail drop). It’s possible that you’ll hear before Labor Day, but that’s an optimistic take given typical mail delays.
I was wondering approximately what day you’ll have the cutoffs released by?
Abhi,
Semifinalist notifications were mailed to schools on 8/27. Reports should start dribbling in and then reach a frenzy next week. The official press release date is September 11, and some schools hesitate to notify students before that date.
When do you think you will get more information? I saw that last year all cutoffs were confirmed by August 30.
Matthew,
NMSC waited an extra week this year to mail announcements to schools. It may not be until the end of next week until we have everything pinned down. I’ll certainly be keeping this page up-to-date.
Hi Art,
I read in one of your previous posts that you would know more about the cutoffs by the middle of this week. I was wondering whether you know what the cutoff for California is. Unfortunately we have not been able to find out from our school.
Thanks,
Umesh
Umesh,
NMSC moved its mailing back a week this year. Your school should be receiving word in the next few days, but the USPS can be agonizingly slow at times.
Hi Art,
Thanks. Also thanks so much for the great service you are providing. We will let you know if we are able to find out anything from our school.
Hello Art, Wow, what a great service you provide! Thank you!! Our student seems to have made the “commended” status/level cutoff with a 214 in Colorado. (Fun that it was the highest score at our tiny school.) She has not had any notification of this and I wonder if I am misinterpreting the process. I asked our school administration early this summer (2019) and they replied that they had not received communication. I decided to wait for the September notification but now I see that it looks to have been April when the commended status cutoff was provided. Are the official results for all levels announced in September? Your thoughts? Thank you again!
Gretchen,
What can make it confusing is that the Commended level is known in April, but Commended students aren’t notified until mid-September. Schools don’t receive updates on Commended students until after the Semifinalist press embargo date of September 11.
Per CC posters that called NMSC, info was sent to the schools in bulk on Tuesday 8/27/19
Thank you, Julie. I’ve updated this page to reflect the news.
Hi Art — Have you heard anything for NC?
Gertrude,
Nothing yet. Announcements were mailed a week later than we expected.
Art,
I am a current senior in the state of Louisiana. My index is 217. What do you think my chances are of being a Semifinalist? Do you have any reasons to believe the cutoff will go up to 218 this year?
Thanks!
Claire,
So far most of the indicators nationwide have been “neutral,” but even in such years we typically see 10-20 states with cutoff rises. Your odds are better than even, but we don’t yet have information on Louisiana.