

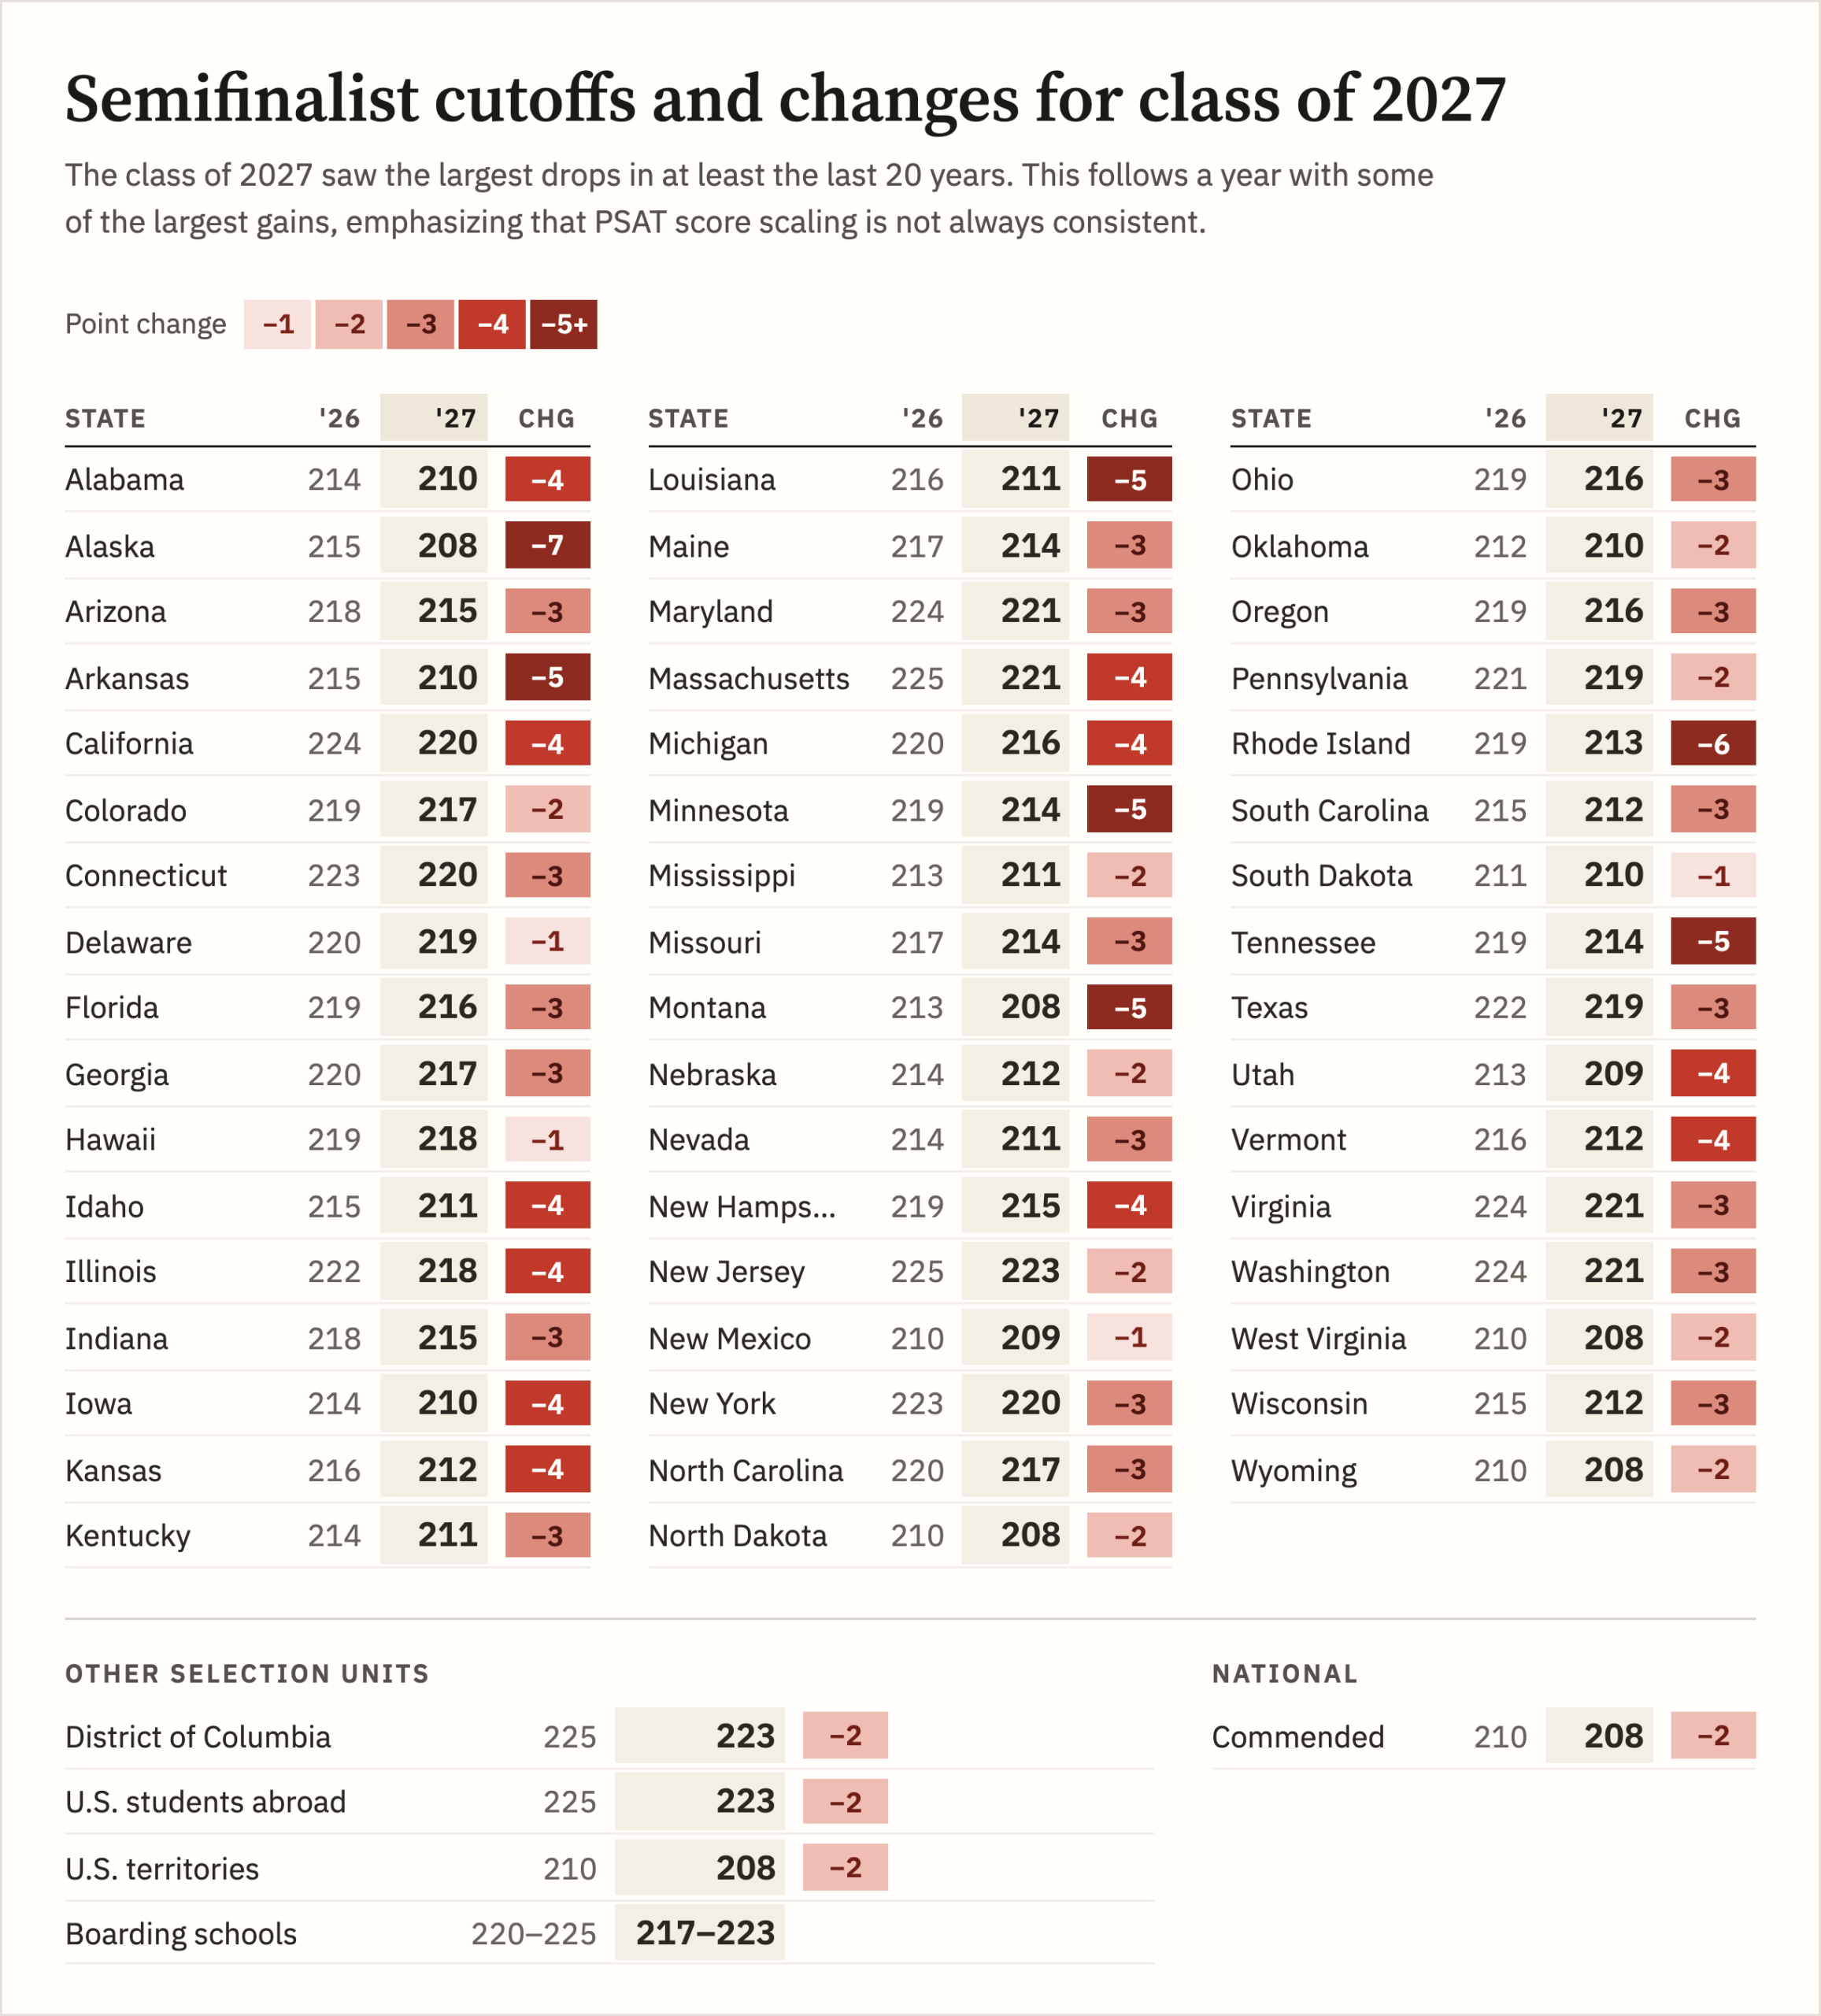
After months of speculation and projections, the official National Merit Semifinalist cutoffs for the class of 2027 were released September 9th. On average, these are the lowest cutoffs in National Merit history, with all 50 state cutoffs sitting lower than they did last year. Most cutoffs went down at least 3 points from the class of 2026’s figures. Alaska set the pace with a 7-point decline. New Jersey again finished with the highest mark, dropping from 225 to 223. Compass will explore:
- How the class of 2027 results stack up historically and how cutoffs are set
- The lower number of Semifinalists nationally
- Why cutoffs declined so precipitously. Hint: It’s not the students.
- The implications of score instability for students, schools, and states
- What the class of 2028 might expect after they take the PSAT/NMSQT in October 2026 and on what timeline
The junior-year PSAT is also the National Merit Scholarship Qualifying Test (NMSQT). Each year, National Merit recognizes the top 55,000 test takers. To be included in that group, students must be among the top 4% of the 1.3 million eligible students who take the PSAT. Of that elite group, approximately 16,500 are recognized as Semifinalists for having the highest scores within their states. Semifinalists have the opportunity to continue in the program to become Finalists and, potentially, scholarship recipients. Some colleges provide significant scholarships and even “full-rides” for Finalists. The remaining 39,000 students are recognized as Commended Students. More information can be found in our National Merit Explained post.
National Merit uses the Selection Index (SI), found on the PSAT score report, to rank students. The Selection Index is calculated by doubling the Reading & Writing score (RW), adding the Math score (M), and dividing that sum by 10. For example, a student with a 720 RW and 700 M score has a Selection Index of 214: (720 x 2 + 700) ÷ 10. A student with a 700 RW and 720 M has a Selection Index of 212. The highest SI a student can receive is 228 (760 RW and 760 M). The weighting of the index means that not all students with the same Total Score have the same SI. “Will a 1450 qualify?” is not the right question. Instead, look at whether a 750 RW and 700 M will qualify.
Summarizing the changes seen for the class of 2027
In October 2015 the PSAT moved to a 320-1520 scale, which was set to provide vertical alignment with the SAT’s 400-1600 scale. The class of 2017 was the first group of students taking the redesigned PSAT/NMSQT, so the fairest comparisons are in the last eleven class years.
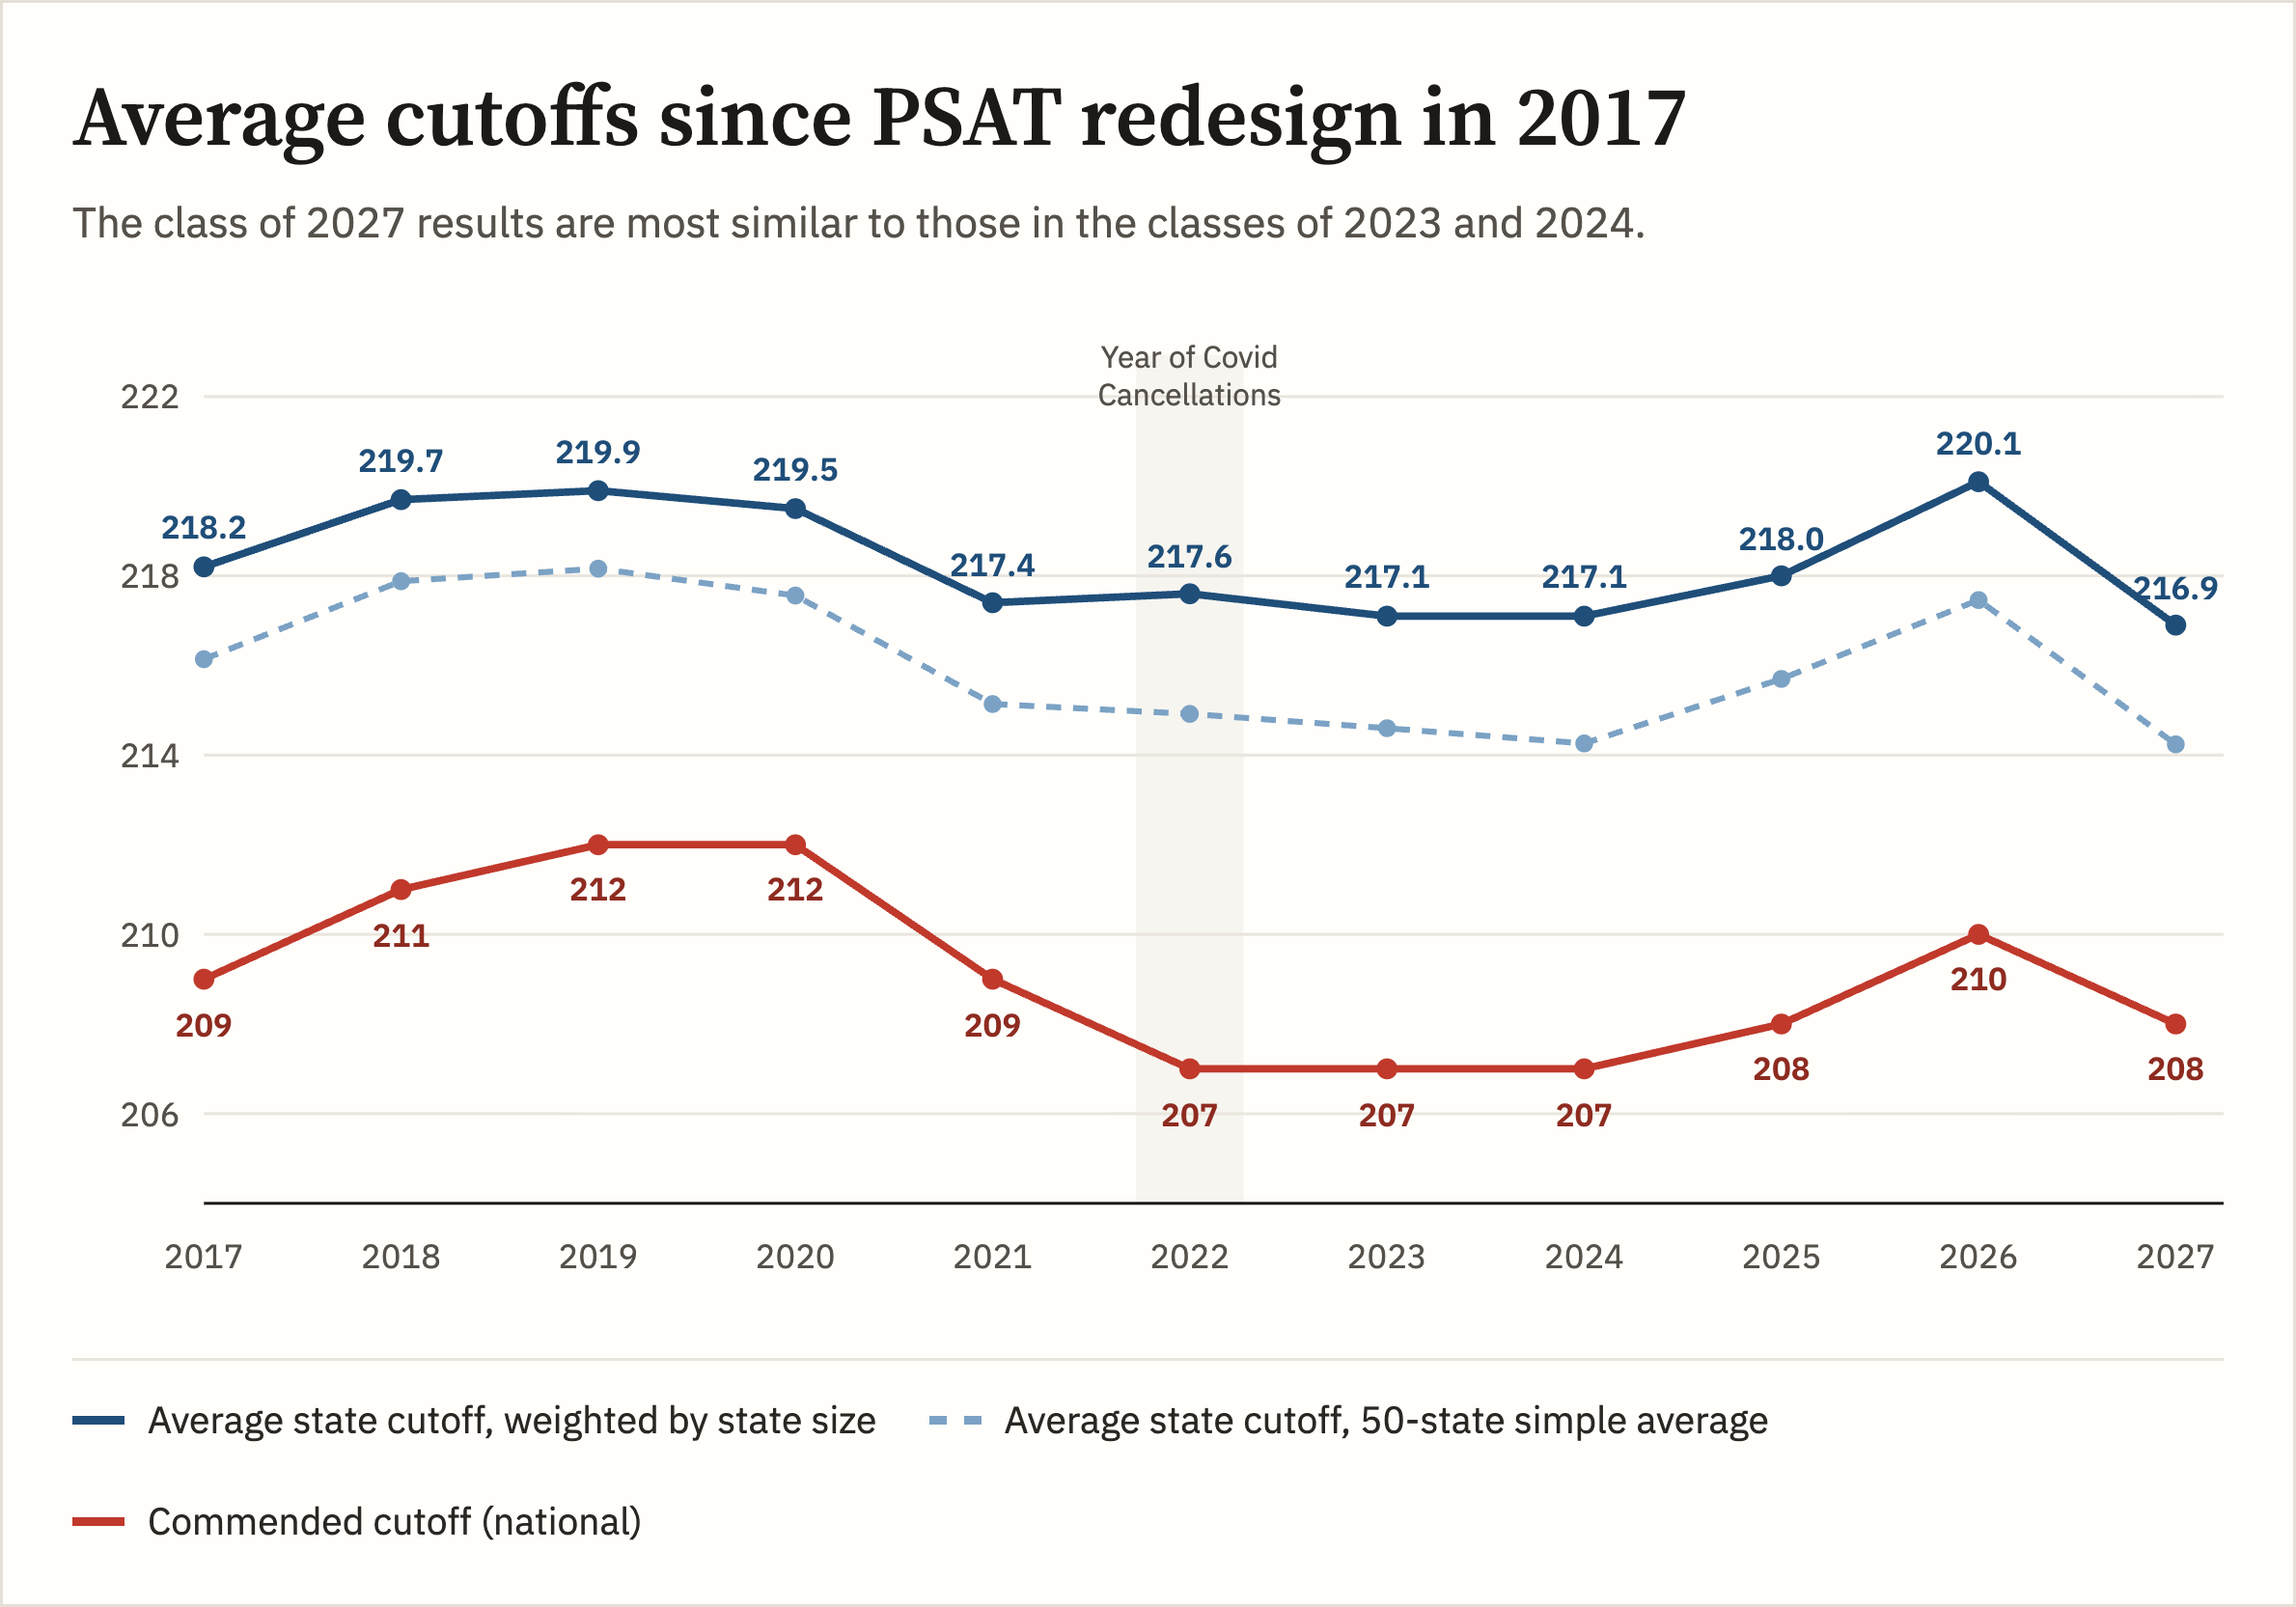
This year saw the average Semifinalist cutoff hit a record low. It provided something of a mirror image to the class of 2026. Last year, 11 states set new record highs in the modern PSAT era, and 10 more tied their records. This year, 5 states established new lows, and 18 tied their record lows. Kansas and Minnesota both dropped 2 points below their previous lows, an unusual event for mid-sized states. Even more unusual was what happened in the largest dozen states. None of those has ever seen a drop of more than 3 points, but this year saw California, Illinois, and Michigan fall 4 points.
Results this year were closer to those in the class of 2024 than they were to the previous two years’ results. Recency is not always a predictor of future results. The Commended level, which is set nationally, declined 2 points this year to 208. The Semifinalist cutoffs, in contrast, fell 3 points.
Entry requirements for National Merit versus qualifying for National Merit.
Your PSAT/NMSQT score report tells you whether you meet the eligibility requirements for the NMSP. In general, juniors taking the October PSAT are eligible. If you have an asterisk next to your Selection Index, it means that your answers to the entrance questions have made you ineligible. Your answers are conveniently noted on your score report. If you think there is an error, you will also find instructions on how to contact NMSC. Meeting the eligibility requirements simply means that your score will be considered. Approximately 1.3 million students enter the competition each year. Only about 55,000 students will be named as Commended Students, Semifinalists, Finalists, or Scholars. See National Merit Explained for more information.
Why did the total number of Semifinalists decline?
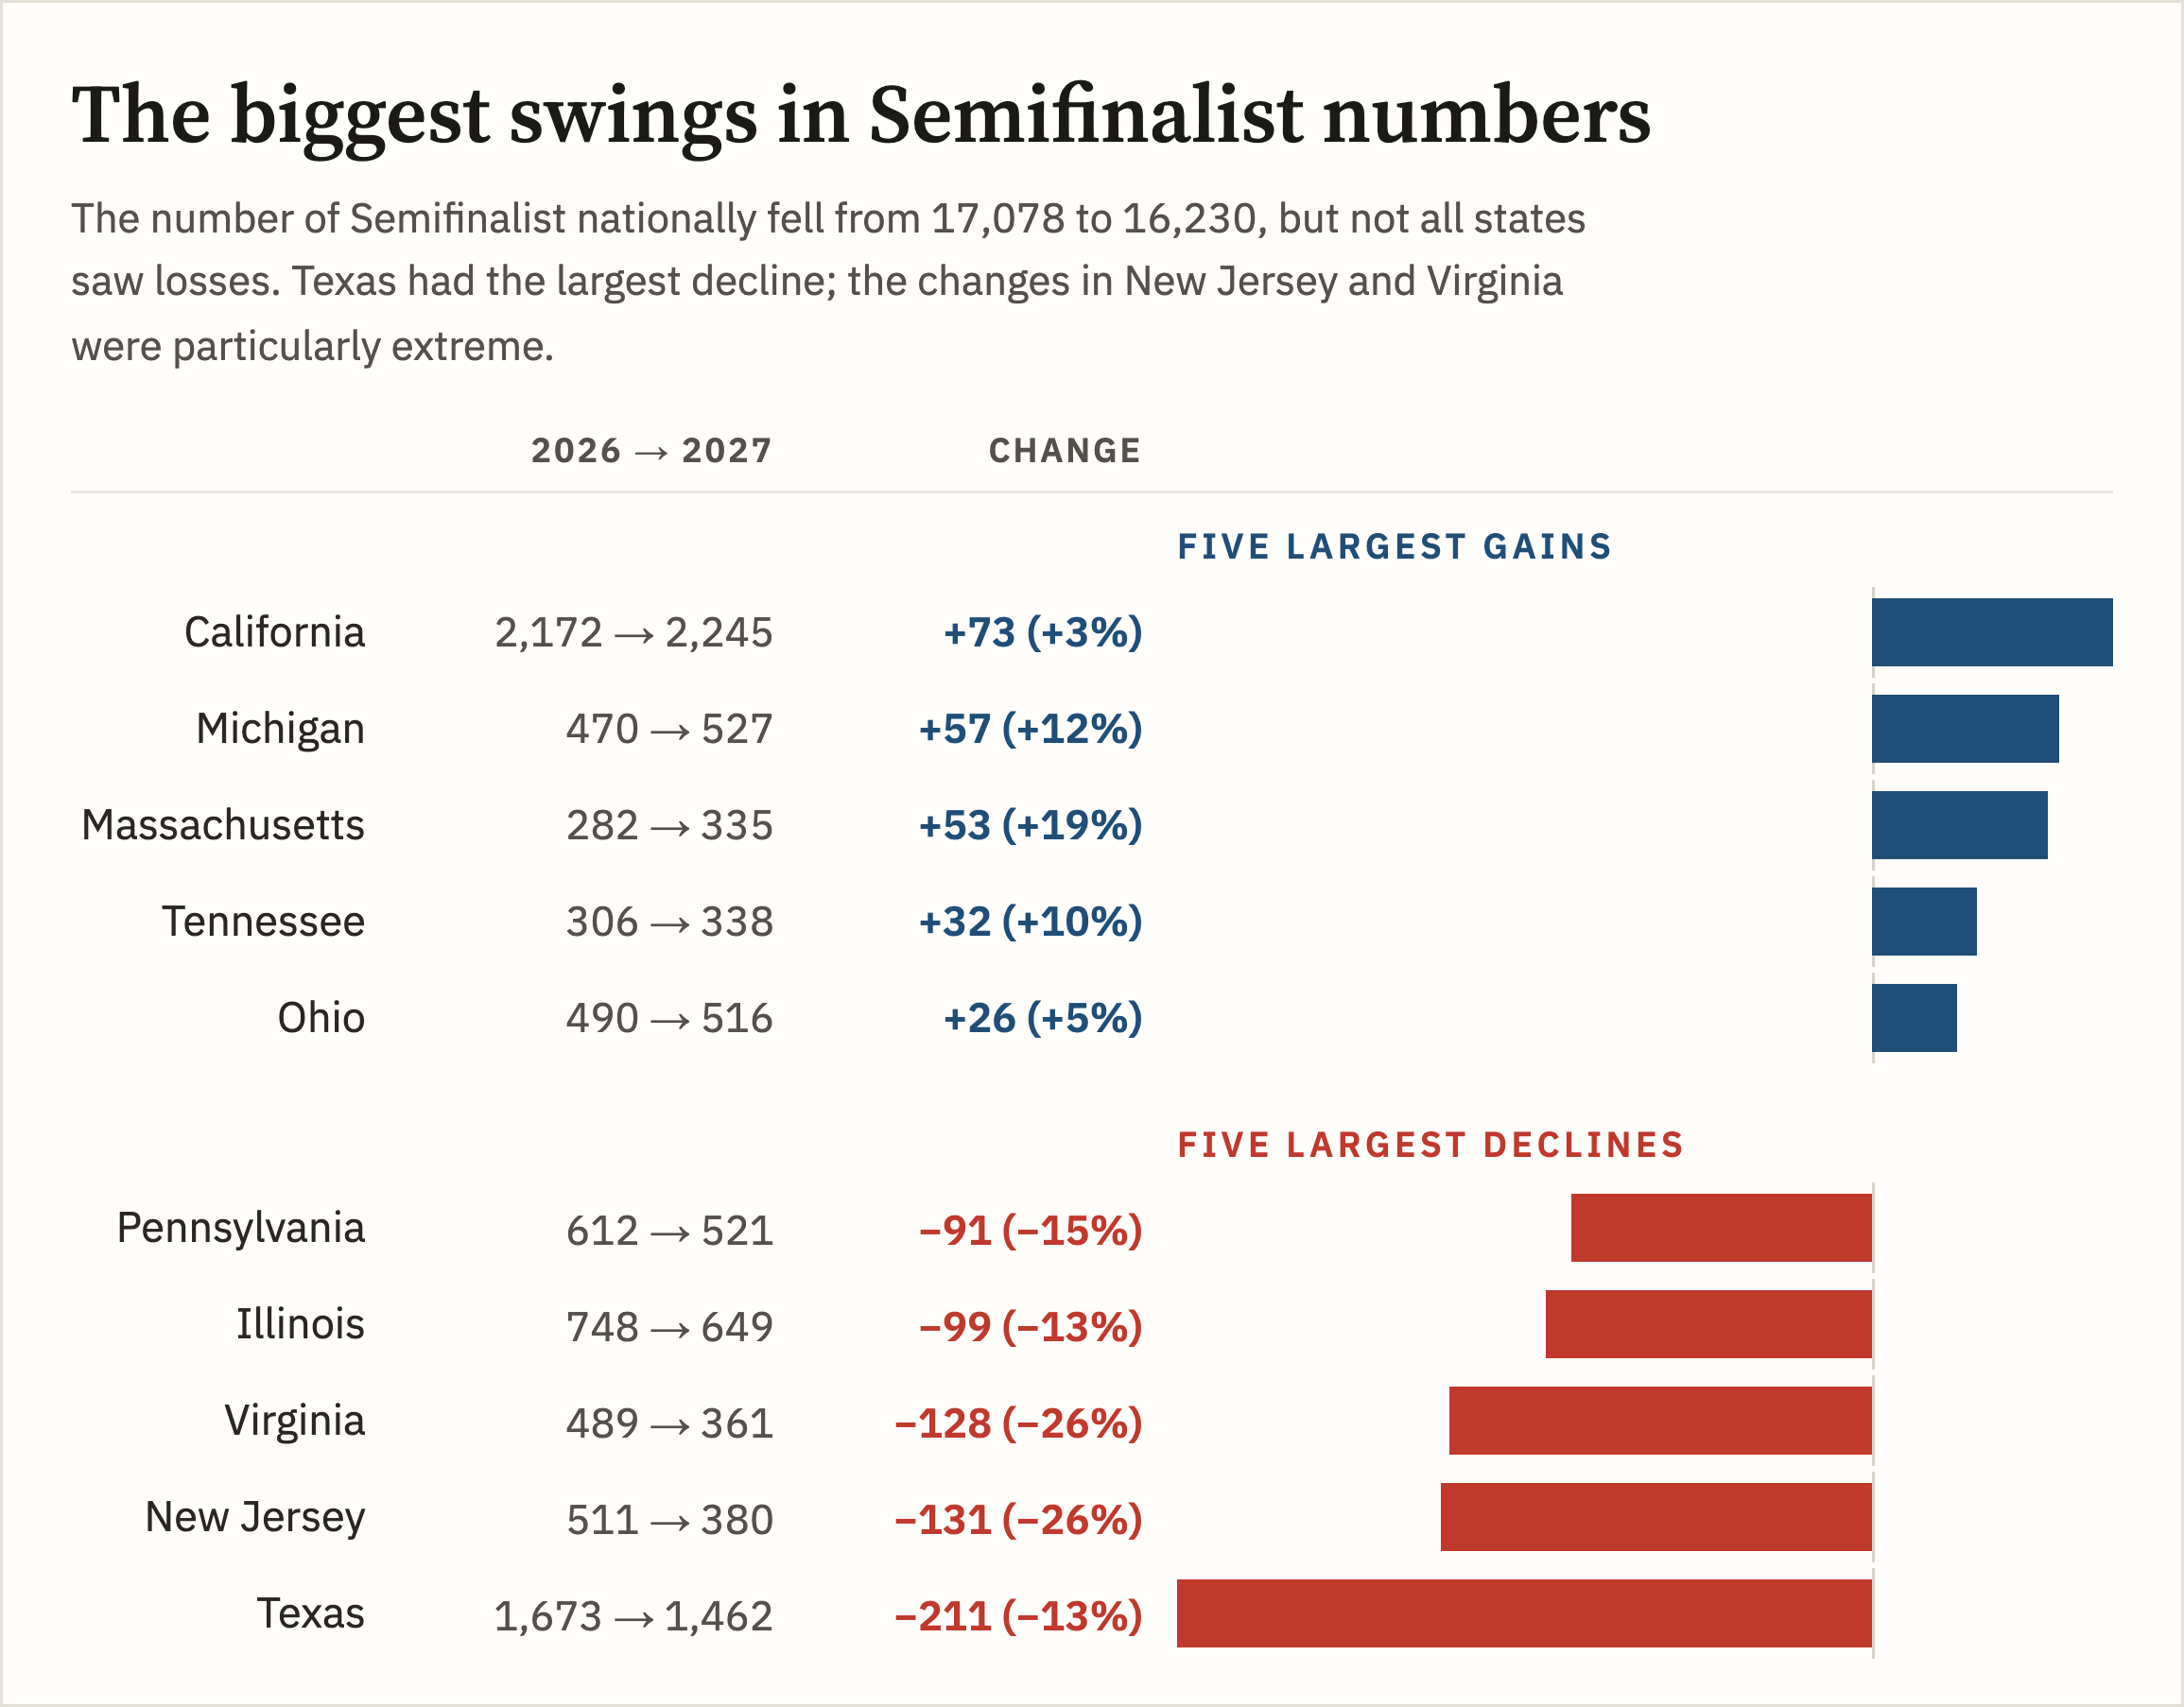
After recognizing more than 17,000 Semifinalists in the prior two years, the class of 2027 saw only 16,230, a decline of 5%. The decline in Semifinalists is a separate issue from lower cutoffs. Setting cutoffs can be a blunt tool. In a large state, there may be more than 200-300 students at a single score. Small states might have multiple scores with zero students. NMSC can’t always hit its targets on the nose. Below are the largest swings in both directions.
How Semifinalists are allocated among states
It’s possible that NMSC recalibrated the total target number of Semifinalists this year. It helps to understand how National Merit sets cutoffs. NMSC allocates a target number of Semifinalists to states based on their population of high school students, not all of whom take the PSAT. If Texas is allocated 1,500 Semifinalists based on its population of high school graduates, then NMSC works down from a perfect 228 Selection Index until it gets as close as possible to that target. In the class of 2027, 1,462 students scored at or above the cutoff of 219. A cutoff of 220 would have produced too few Semifinalists. A cutoff of 218 would have gone over the allocation. As scores go lower, more and more students occupy each level, and where the crowd forms does not stay consistent from year to year. It is easy for cutoffs to move up or down a point even when there is minimal change in testing behavior or performance. All students at or above a cutoff qualify.
The changes in the above chart fit within the historical pattern, so students should expect similar swings to happen in the future. New Jersey had about the same number of Semifinalists in 2023 as it saw this year, and actually fell from a greater height compared to 2022. Similarly, Texas saw fewer than 1,462 Semifinalists in classes of 2020, 2021, and 2022. And there is little chance that NMSC calculated that Texas’ high school population was falling faster than, say, California’s. We won’t know until next September whether the 16,230 Semifinalists was a fluke or a new standard.
The Mystery of the Declining PSAT Scores
When you have eliminated the impossible, whatever remains, however improbable, must be the truth. National Merit cutoffs may not have the makings of a Sherlock Holmes novel. The guilty party is too easy to identify and the deduction not all that improbable. To borrow from another mystery trope: it’s College Board in the testing room with a faulty scale.
When test scores change from year-to-year, College Board issues press releases discussing testing patterns and student achievement. What they never include is “That one’s on us.” When it comes to National Merit scores, however, it often is.
A history of change
Over the last seventeen years, there have been six classes that saw cutoffs change in more than forty states. The heat strip below shows how cutoffs shift from year to year.
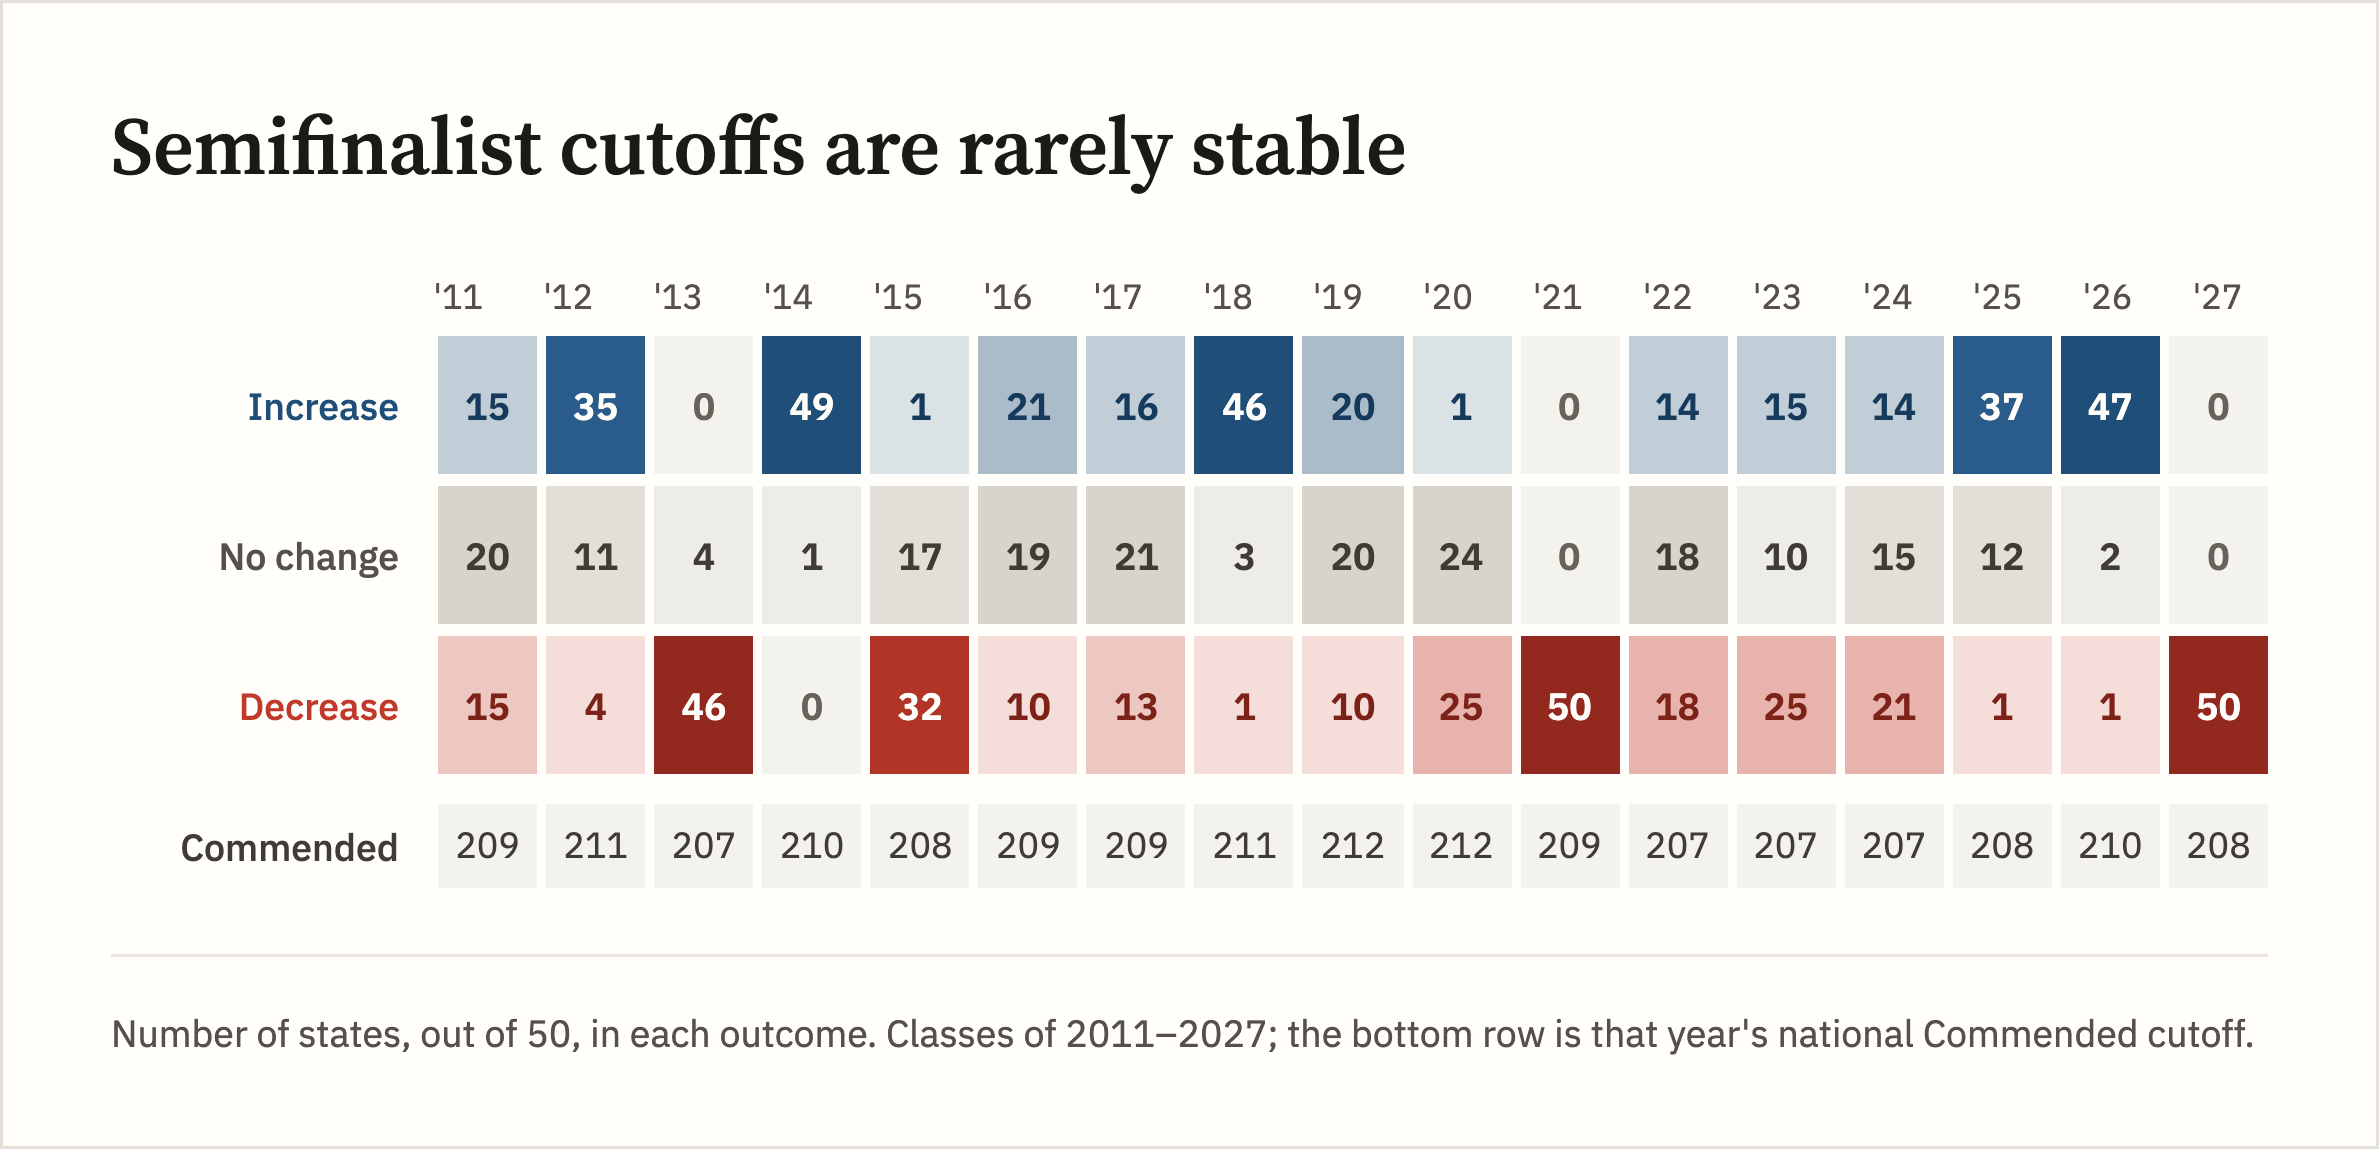
Even if we eliminate “bounce back” years where scores come back into line after an unusual shift, a major disruption occurs approximately every 4 years. Interestingly, none of those scoring disruptions can be attached to the biggest behavioral disruption of all — the Covid cancellations that drove PSAT/NMSQT volumes below one million for the first time in decades. In addition to last year’s exam, the PSATs from 2011 (class of 2013), 2016 (class of 2018), and 2019 (class of 2021) stand out as problematic. The anomalous 2019 results could be traced back to a particularly mis-scaled form, which I wrote about at the time. The class of 2014 also saw significant changes, but those were more of a bounce-back from the previous year, similar to what we are seeing with the class of 2027.
When Semifinalist cutoffs reached vertiginous levels last year, several theories made the rounds:
- (A) Covid-related learning losses were vanquished
- (B) The integrated Desmos calculator on the digital PSAT had “broken” the Math section
- (C) Test preparation — and maybe AI-enabled test preparation — had made the test too easy
- (D) The test taking population shifted
Compass disputed each of these theories, but it wasn’t until this year’s free-fall that we could put each of them fully to rest. A key piece of evidence is which scores rose and fell.
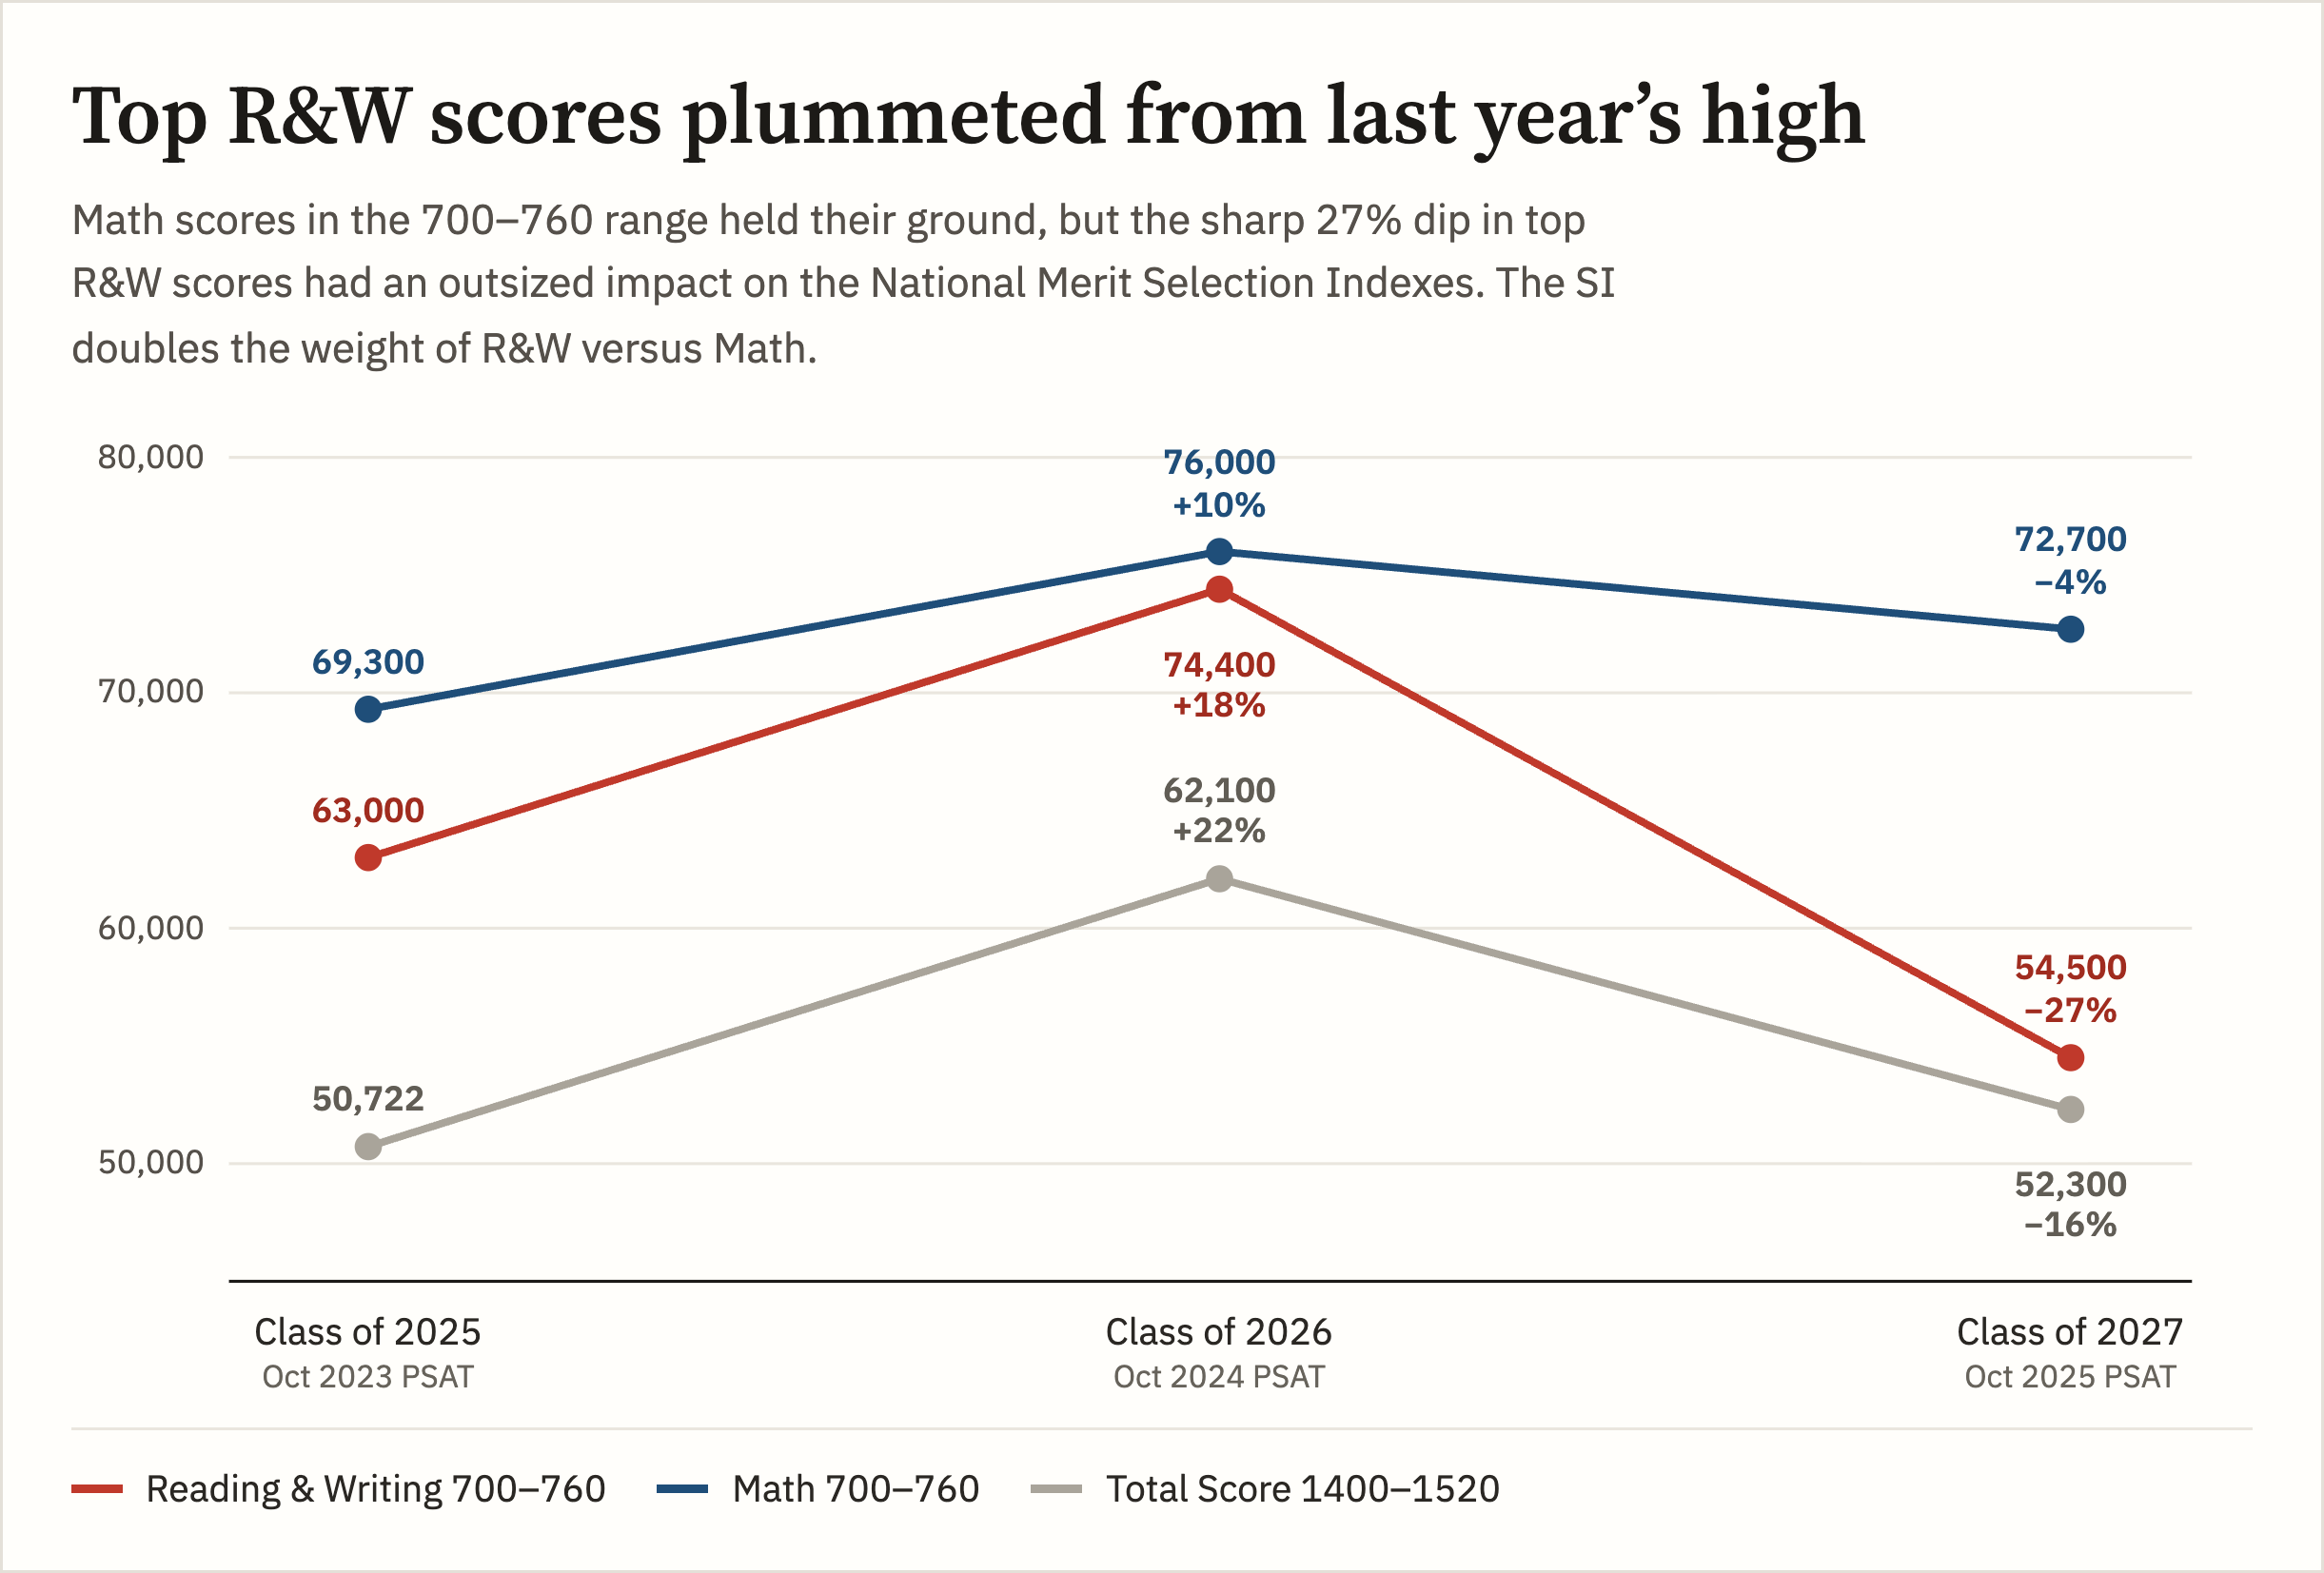
Over the most recent three PSATs, the highest reported Math scores (College Board groups all 700-760 scores together) did go up on the October 2024 PSAT, but they settled back down on the October 2025 PSAT. If improving Math skills were the key driver, why did they not keep progressing upward? The fall PSAT also provides an inherent double-check, because sophomores and juniors both take the exam in similar numbers. Sophomores and juniors consistently tracked each other across the different exams. The class of 2025 and 2026 overlapped, then 2026 and 2027, and then 2027 and 2028. Every PSAT the movement has been similar. Yet sophomores do not do test preparation in sufficient force to shape score results. The sets of classes were in different points of math development during remote learning, and yet they showed the same rises and falls. Learning loss and test preparation do not provide coherent answers.
Reading & Writing scores were the true driver of the class of 2026 records and the 2027 declines
High RW scores are typically less common than high Math scores. But on the October 2024 PSAT, almost as many students scored 700-760 on RW as on Math. Top scores went up by 18%. The double-weight that RW scores provide in the Selection Index pushed cutoffs to new highs. The 210 Commended ranked only fourth when compared to the previous decade. Earlier class years saw cutoffs of 211 and 212 (twice). So why did last year’s cutoffs rise to levels that had seemed impossible? The highest cutoffs had never exceeded 223 (Maryland’s 224 in the class of 2022 was due to every PSAT in the state being cancelled and students qualifying via SAT scores). How did New Jersey and Massachusetts reach 225 and California, Maryland, Virginia, and Washington end up at 224? The best explanation is that the very top RW scores — 740-760 — increased at an even higher rate than 700-730s. A 225 cutoff is not possible without at least a 750 RW. A 224 requires at least a 740 RW. Students were acing the test in record numbers.
The plummet for the class of 2027
On the 2025 PSAT, the number of high RW scores dropped by 27%. In fact, the RW count for the class of 2027 is even lower than it was two years ago. The surfeit of 700+ scores dried up. Obtaining a 740-760 grew harder. As with Math scores, sophomore performance changes matched that of juniors.
Process of elimination
The rapid gains and collapse eliminate (A), (B), and (C). As sophomores, the class of 2027 was phenomenal at reading according to the PSAT. Post-Covid learning changes cannot explain why they suddenly struggled as juniors. Option (B) doesn’t fit, because Math scores were not the source of the changes. Why would test preparation have stopped working (C), and how can it explain that sophomores and juniors were similarly impacted across the years? This leaves (D) as a remote contender. Except that it fails to explain the 50-state reach of the changes and the magnitude of the changes even in the largest states.
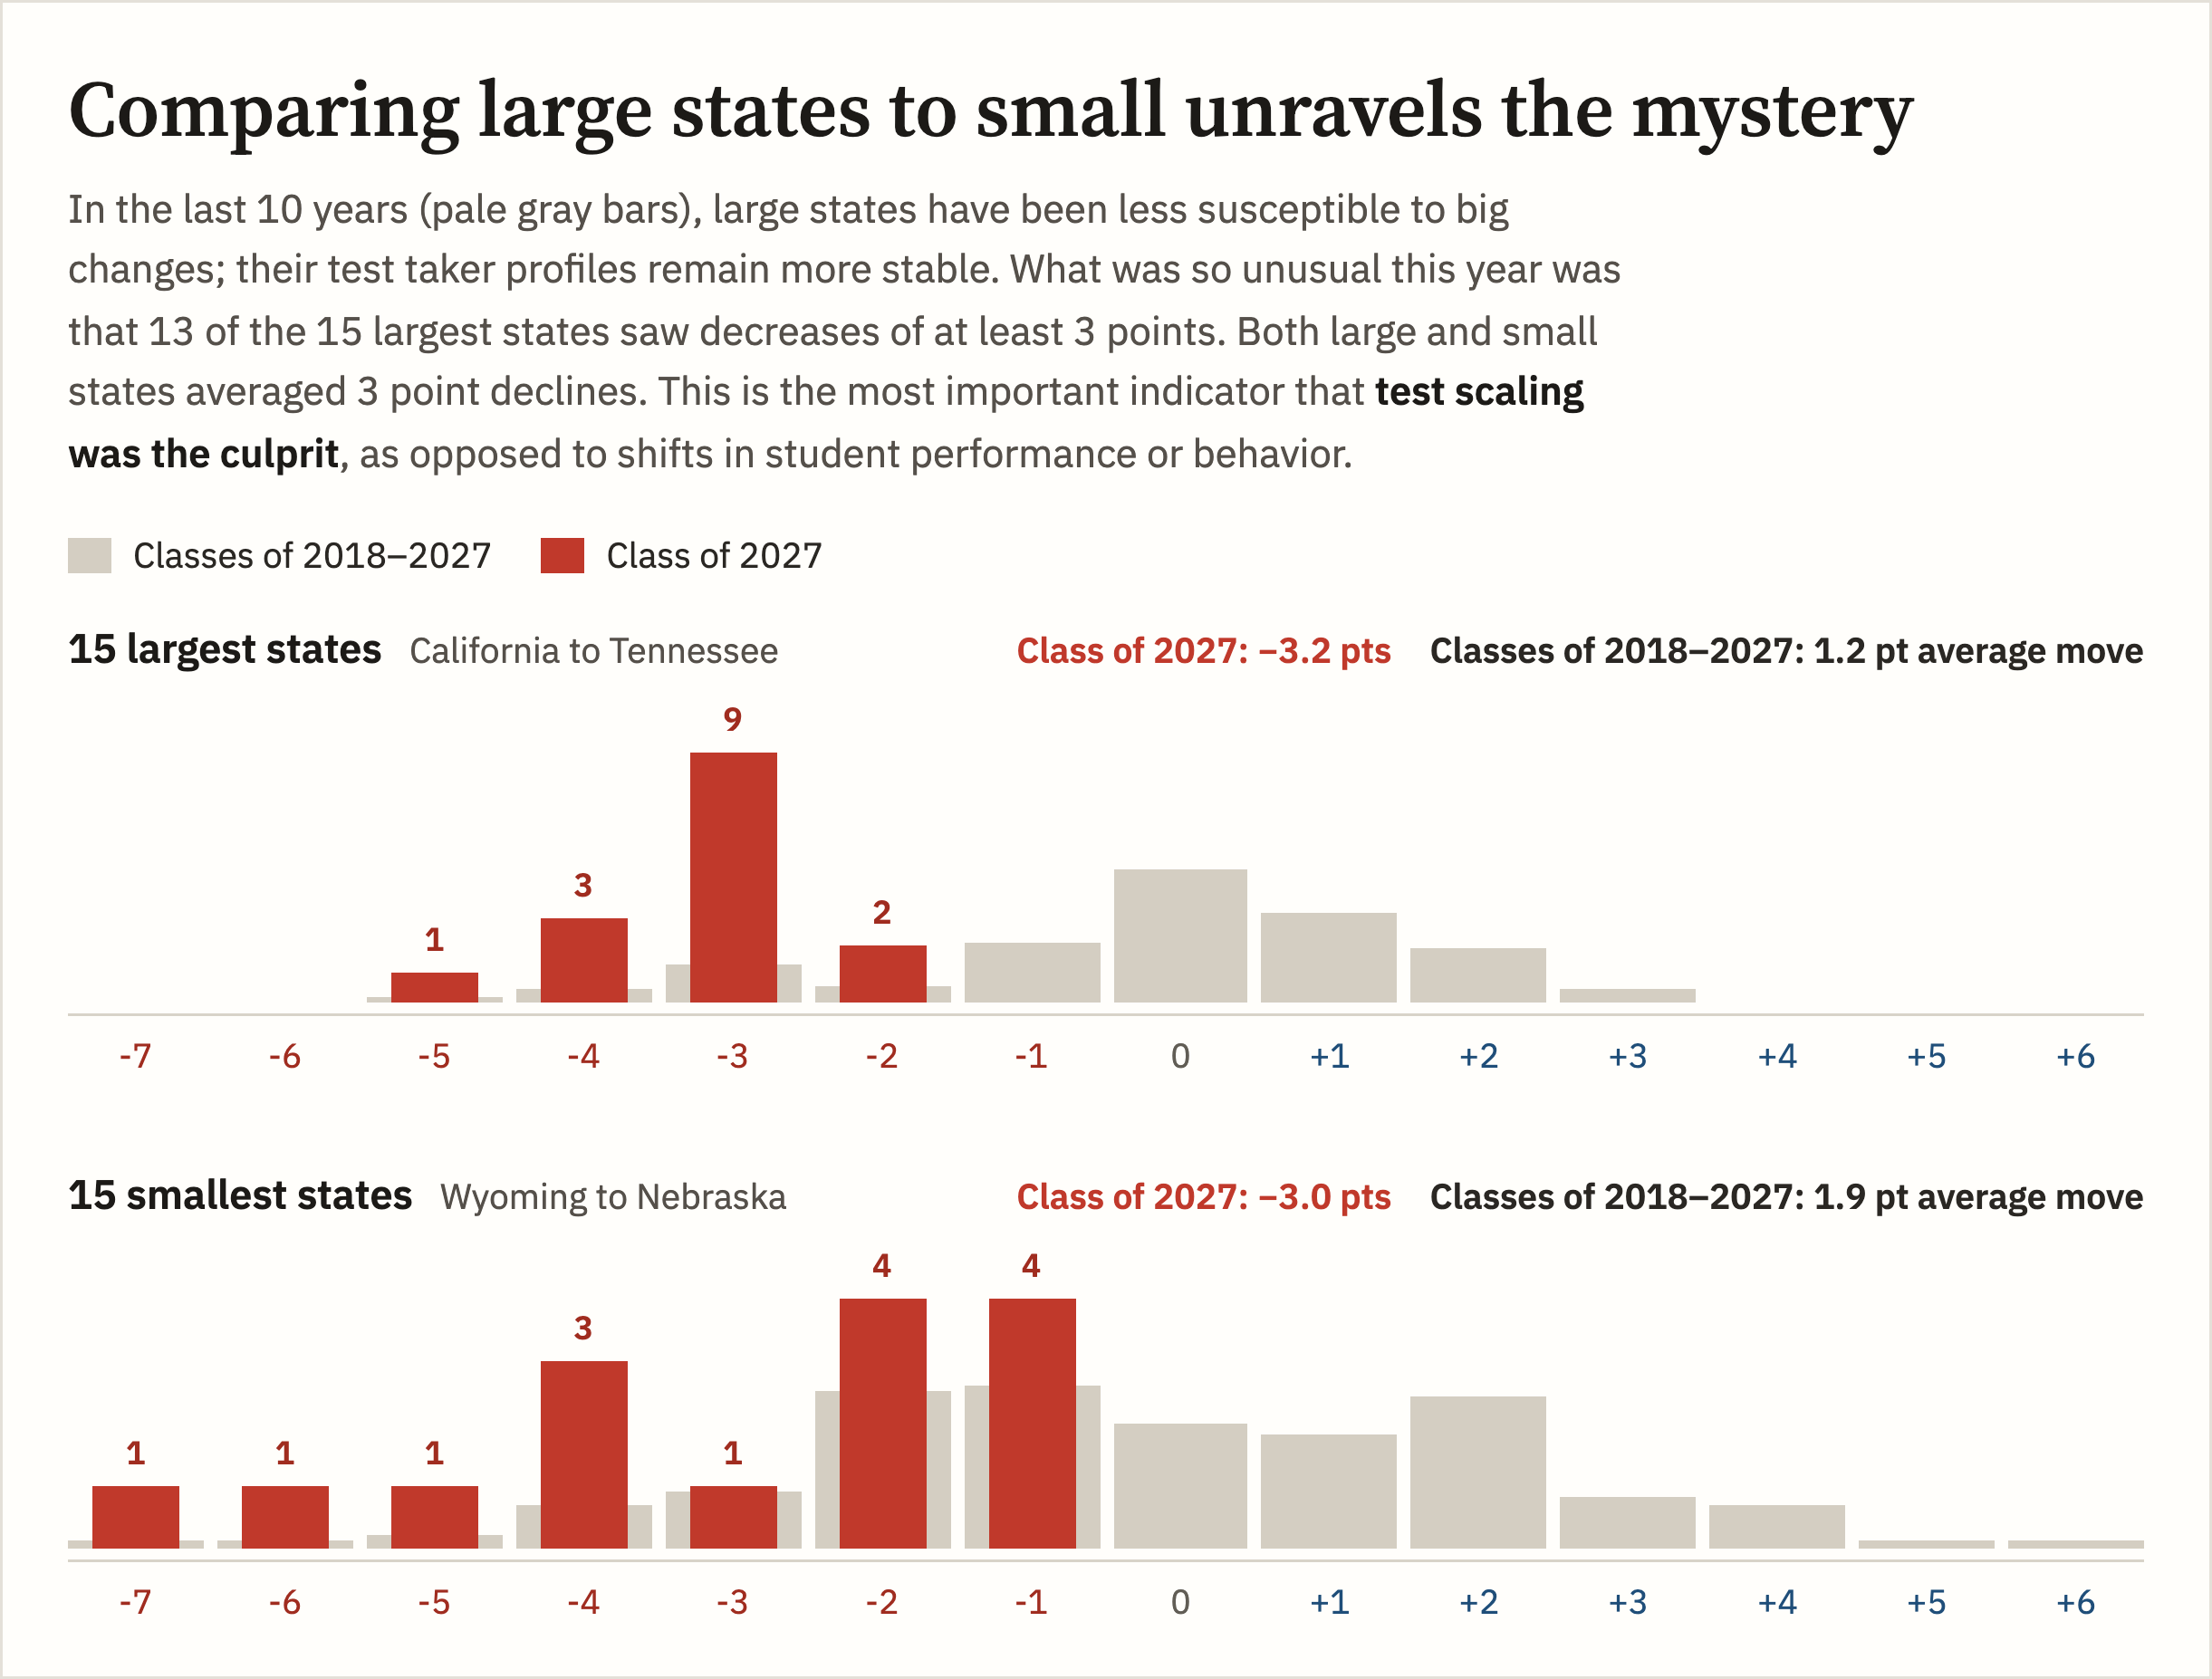
Thirteen of the largest fifteen states dropped by 3 points or more. Pennsylvania and New Jersey saw 2-point declines. If the smaller states were pulling down the class of 2027’s average cutoffs, we might at least attribute some of the disruption to the instability of cutoffs when there are fewer than 100 Semifinalists. That’s not what happened. And if only a few large states saw inflows or outflows of top test takers, the impact would have been muted. Nor did overall test taker numbers change much. When the entire set of large states has this magnitude of a change, the test scale itself has to be at the heart of it.
What does a 3-point change represent and why is it so bad?
For simplicity, the change can be characterized as a 15-point miss in RW on the 160-760 scale (200-800 on the SAT).
- The typical annual growth in RW scores is about 40-50 points, so the scale change represents approximately one-third of an academic year.
- Systematic scaling error is additive to individual student fluctuations in scores — typically around +/-30 points on each side of the PSAT and SAT. Scaling error makes it harder for students to determine where they will score and how their score stacks up.
- Scaling error produces incorrect percentile ranks, because percentiles are based on the 3 prior years of results. Sudden inflation or deflation gives an inaccurate read.
- The PSAT is used for purposes beyond National Merit such as AP placement or state-mandated testing. Results may not align with prior years or academic growth expectations.
- When error happens primarily on one side of the PSAT, some students are unfairly disadvantaged.
- In a competition such as National Merit where relative standing matters, a uniform increase or decrease might be tolerable. A rising tide lifts all students (sort of). Except that there is no way of knowing whether the error applied equally to all students. The digital PSAT is not a single form or even a limited set of forms. Exams across the PSAT testing window can vary, and even on the same test dates, students often see differing questions. It’s one of the security advantages provided by digital testing, but it can also be a curse. College Board provides no reporting on the items or scaling, so students (and Compass) have no way of assessing the impact on individuals. Schools have no way of knowing if their students were hit harder than at other schools.
- This keeps happening. Is College Board having difficulty keeping the digital PSAT scale consistent or will things stay more consistent over time? The historical record says that they will not.
Do these sorts of systematic scaling errors occur on the SAT?
They do. They are harder to spot, but likely even more common. Noted above is that the largest disruptions on the PSAT/NMSQT occur, on average, every 4 years. The SAT is given on (a) 8 national dates every year, (b) during a 2-month SAT School Day window in the spring, and (c) during a 1-month window in the fall. This accelerates the chance for errors. It creates a near certainty that some students will encounter systematic error in their favor and others will see it working against them.
The PSAT and the National Merit Scholarship Program provide a unique laboratory. The PSAT/NMSQT represents one slice in time. The population of PSAT takers is relatively stable from year to year, and the sophomore and junior PSATs provide a sort of longitudinal double-check. The 50 state cutoffs and their varying levels give information about the extent of scaling errors. Comparing ever-shifting SAT dates is difficult, especially because College Board restricts access to the data. It is unfortunate that the primary protection students have is taking the SAT multiple times. In combination with superscoring, it represents the best way for students to lock-in positive error.
How do errors happen? Shouldn’t scores stay consistent?
When new tests are designed, not every problem can be tested on previous populations of students. Instead, a sampling of problems is tested with a sampling of students, perhaps 4-5,000. In theory, that’s a significant enough size that random error will make little difference. The sample group should be comparable to the entire population. Random error is an acceptable part of test creation, because it largely cancels out at scale.
But what if the error is not random? What if the test design is flawed? For example, if the methodology continually overestimates the ability of the sample groups, future questions will be predicted to be harder than they really are. And then over-prediction may happen with the next group. This systematic bias can creep into a test production and equating process. Normally it is spotted. As we see from the October 2024 PSAT and similar examples, sometimes it is not. The National Merit program provides a challenge to test creators, because everything important happens in a narrow part of the scale. On the digital PSAT, only 50 questions count toward a student’s score. Differentiating between a 720 student, for example, and a 730 student, and a 740 student rests on small differences in performance. If College Board has the statistics even slightly off, scores will not align well across tests. We saw the occasional wild ride on the paper PSAT, but the rides may get wilder and more frequent on the digital PSAT.
Predictions and timeline for the class of 2028 and beyond
Compass has always warned students not to be too fixated on a single cutoff target. The crazy events of the last two years have made it obvious that cutoffs can move in large and unexpected ways. It’s better to think in terms of score ranges rather than a pass/fail score. Prior to the PSAT, we can only estimate based on historical figures, without knowing what kind of surprises College Board has in store. After the PSAT, Compass analyzes the national results in the broad buckets that College Board provides. This usually gives a clear idea of which way the overall trend is moving. We should see how RW and Math scores behave, what the 1400-1520 bucket looks like, and develop a tight estimate of the Commended cutoff. For example, here is the estimate from last year.
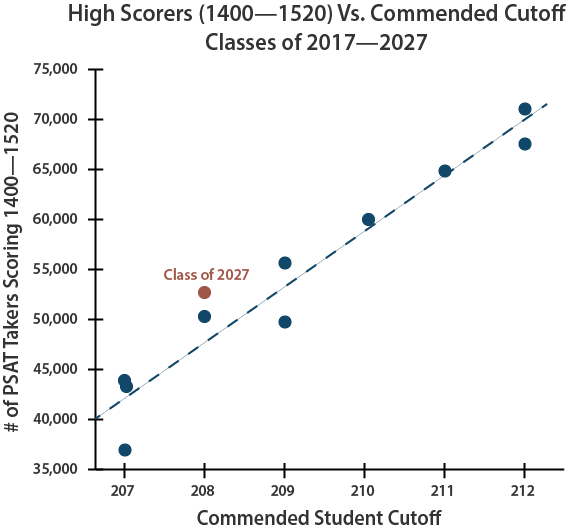
Unfortunately, it does not provide insight into individual states. In April, the Commended level usually leaks, and we get confirmation of the national trend predictions. It’s not until Semifinalist notifications start being handed out in late August that state-by-state information starts coming into focus.
Below is a pre-PSAT summary. Find the range of potential cutoffs in your state, and how it has stacked up in recent class years. Below the table is more information about the National Merit program. You may also want to consult our post on National Merit Explained, which goes more into the steps of the process, what different honors mean, and what sort of scholarships are available.
State | Class of 2028 (Est Range) | Class of 2027 (Actual) | Class of 2026 (Actual) | Class of 2025 (Actual) | Class of 2024 (Actual) | Avg SF Count |
|---|---|---|---|---|---|---|
| Alabama | 209-216 | 210 | 214 | 212 | 210 | 239 |
| Alaska | 207-217 | 208 | 215 | 214 | 209 | 36 |
| Arizona | 214-220 | 215 | 218 | 217 | 216 | 359 |
| Arkansas | 209-215 | 210 | 215 | 213 | 210 | 145 |
| California | 219-224 | 220 | 224 | 221 | 221 | 2,125 |
| Colorado | 216-221 | 217 | 219 | 218 | 216 | 280 |
| Connecticut | 219-223 | 220 | 223 | 221 | 221 | 182 |
| Delaware | 218-222 | 219 | 220 | 219 | 219 | 43 |
| Florida | 215-219 | 216 | 219 | 217 | 216 | 959 |
| Georgia | 216-220 | 217 | 220 | 218 | 217 | 554 |
| Hawaii | 215-220 | 218 | 219 | 217 | 217 | 62 |
| Idaho | 210-216 | 211 | 215 | 213 | 211 | 90 |
| Illinois | 217-222 | 218 | 222 | 220 | 219 | 693 |
| Indiana | 214-219 | 215 | 218 | 217 | 216 | 320 |
| Iowa | 209-216 | 210 | 214 | 212 | 210 | 152 |
| Kansas | 211-219 | 212 | 216 | 215 | 214 | 147 |
| Kentucky | 210-218 | 211 | 214 | 213 | 211 | 208 |
| Louisiana | 210-217 | 211 | 216 | 214 | 214 | 227 |
| Maine | 211-217 | 214 | 217 | 214 | 213 | 61 |
| Maryland | 220-224 | 221 | 224 | 222 | 221 | 313 |
| Massachusetts | 220-225 | 221 | 225 | 223 | 222 | 322 |
| Michigan | 215-220 | 216 | 220 | 218 | 217 | 509 |
| Minnesota | 213-220 | 214 | 219 | 217 | 216 | 284 |
| Mississippi | 209-215 | 211 | 213 | 212 | 209 | 149 |
| Missouri | 213-217 | 214 | 217 | 215 | 214 | 299 |
| Montana | 207-214 | 208 | 213 | 209 | 209 | 46 |
| Nebraska | 210-216 | 212 | 214 | 211 | 210 | 105 |
| Nevada | 210-218 | 211 | 214 | 214 | 211 | 148 |
| New Hampshire | 213-219 | 215 | 219 | 217 | 215 | 64 |
| New Jersey | 222-225 | 223 | 225 | 223 | 223 | 486 |
| New Mexico | 207-215 | 209 | 210 | 211 | 207 | 99 |
| New York | 219-223 | 220 | 223 | 220 | 220 | 998 |
| North Carolina | 216-220 | 217 | 220 | 218 | 217 | 502 |
| North Dakota | 207-212 | 208 | 210 | 210 | 207 | 28 |
| Ohio | 215-219 | 216 | 219 | 217 | 216 | 588 |
| Oklahoma | 208-216 | 210 | 212 | 211 | 208 | 195 |
| Oregon | 215-221 | 216 | 219 | 216 | 216 | 185 |
| Pennsylvania | 217-221 | 219 | 221 | 219 | 219 | 623 |
| Rhode Island | 212-220 | 213 | 219 | 217 | 215 | 50 |
| South Carolina | 209-217 | 212 | 215 | 214 | 209 | 225 |
| South Dakota | 208-215 | 210 | 211 | 208 | 209 | 39 |
| Tennessee | 213-219 | 214 | 219 | 217 | 217 | 324 |
| Texas | 218-222 | 219 | 222 | 219 | 219 | 1,508 |
| Utah | 208-216 | 209 | 213 | 211 | 209 | 181 |
| Vermont | 211-217 | 212 | 216 | 215 | 212 | 30 |
| Virginia | 219-224 | 221 | 224 | 222 | 219 | 412 |
| Washington | 220-224 | 221 | 224 | 222 | 220 | 353 |
| West Virginia | 207-212 | 208 | 210 | 209 | 207 | 64 |
| Wisconsin | 211-217 | 212 | 215 | 214 | 213 | 295 |
| Wyoming | 207-213 | 208 | 210 | 209 | 207 | 21 |
| District of Columbia | 222-225 | 223 | 225 | 223 | 223 | 36 |
| Studying Abroad | 222-225 | 223 | 225 | 223 | 223 | 87 |
| U.S. Territories | 207-212 | 208 | 210 | 208 | 207 | 39 |
| Commended | 207-212 | 208 | 210 | 208 | 207 |
How cutoffs are determined
Qualifying scores (“cutoffs”) are not based on the total score for the PSAT (320-1520) but on the Selection Index, which is calculated by doubling the RW score, adding the Math score, and then dividing the sum by 10. The maximum Selection Index is 228. Students can find a historical set of cutoff data here or see how Semifinalist and Commended counts have changed state by state. Students still ahead of the October PSAT can prepare with small group PSAT classes built around the Selection Index.
Why does each state have its own Semifinalist cutoff if the program is NATIONAL Merit?
This is always a hot button question. NMSC allocates the approximately 16,500 Semifinalists among states based on the number of high school graduates. That way, students across the nation are represented. It also means that there are very different qualifying standards from state to state. A Massachusetts student with a 220 might miss out on being a Semifinalist. If she lived 10 miles away in New Hampshire, she would qualify.
No Semifinalist cutoff can be lower than the national Commended level. Cutoffs for the District of Columbia and for U.S. students studying abroad are set at the highest state cutoff (typically New Jersey). The cutoff for students in U.S. territories and possessions falls at the Commended level each year. Boarding schools are grouped by region. The cutoff for a given region is the highest state cutoff within the region.
When are National Merit Semifinalists announced?
The lists of Semifinalists will not be distributed to high schools until the end of August 2027. With the exception of homeschoolers, students do not receive direct notification. NMSC asks that schools not share the results publicly until the end of the press embargo in mid-September, but schools are allowed to notify students privately before that date. NMSC does not send Commended Student letters to high schools until mid-September. Compass will keep students updated on developments as the dates approach.
Do state and national percentiles indicate whether a student will be a National Merit Semifinalist?
No! Approximately 1% of test takers qualify as Semifinalists each year, so it is tempting to view a 99th percentile score as indicating a high enough score — especially now that College Board provides students with percentiles by state. There are any number of flaws that rule out using percentiles as a quick way of determining National Merit status.
- Percentiles are based on section scores or total score, not Selection Index
- Percentiles are rounded. There is a large difference, from a National Merit perspective, between the top 0.51% and the top 1.49%
- Percentiles reveal the percentage of students at or below a certain score, but the “at” part is important when NMSC is determining cutoffs.
- The number of Semifinalists is based on the number of high school graduates in a state, not the number of PSAT takers. Percentiles are based on PSAT takers. States have widely varying participation rates.
- Most definitive of all: Percentiles do not reflect the current year’s scores! They are based on the prior 3 years’ performance. They are set even before the test is given. And if you are going to use prior history, why not use the record of prior National Merit cutoffs rather than the highly suspect percentiles?
Entry requirements for National Merit versus qualifying for National Merit.
Your PSAT/NMSQT score report tells you whether you meet the eligibility requirements for the NMSP. In general, juniors taking the October PSAT are eligible. If you have an asterisk next to your Selection Index, it means that your answers to the entrance questions have made you ineligible. Your answers are conveniently noted on your score report. If you think there is an error, you will also find instructions on how to contact NMSC. Meeting the eligibility requirements simply means that your score will be considered. Approximately 1.3 million students enter the competition each year. Only about 55,000 students will be named as Commended Students, Semifinalists, Finalists, or Scholars. See National Merit Explained for more information.

Hi Art,
With a commended cutoff of 209, how confident would you be that 220 for CA qualifies for semifinalist?
Thanks!
KF,
I think a 209 tells us too little about the top of the range. I still believe that CA’s cutoff will move lower and I haven’t changed my Most Likely, but I don’t think I would go as far as to say that I am confident a 220 will qualify.
Thanks Art! Would you say it’s 50/50 odds or something higher?
That sounds right. Maybe 60/40 only because 219 can’t be completely ruled out.
Good morning…
My son has been anxiously awaiting these numbers…we live in Arkansas, and he scored a 212. We are over the moon with the prediction being a 212…do you feel that still is likely have him qualify? Thanks for all the info
Pamela.
The 209 was good news. With around 140 NMSFs, though, Arkansas’ cutoff can float around more than many others’. In the last 4 years, it has twice come in at 4 points above the Commended level and in the last two years it came in at 2 points above. Let’s hope it is no more than 3 points above Commended this year!
Hi Art,
My son has an SI of 221 in CA. Can you please tell me how certain this can qualify for semifinalist? With a percentage ratio?
Thanks!
Karpagam,
Because College Board releases a limited amount of information and does not break things down by state, I have to be cautious in predictions. For the class of 2017, there was a 209 Commended level and CA was at 222. I think this year is different. The high end of the scale was impacted, in my opinion, more than it was in 2017. I would put a 221 qualifying as 80/20 or even 90/10. The limited data I have seen coming out of schools simply doesn’t fit with a 222 cutoff.
Thank you Art! When is the earliest that we could find about the semi finalist status?
We’ve got quite the wait. NMSC usually mails out notifications to schools in late August. Word doesn’t start trickling in until about Labor Day.
My child has a index score of 195 and says falls in the 97% . Which is still good score don’t get me wrong. But sounds like from what I have read this score is not close to getting even Commended so why is my child still looks like they are in the running for this?
Lynn,
I don’t believe there are official percentiles for the Selection Index (if you are seeing one on the score report, I’d be interested in hearing more). You may be seeing the percentile on the overall score. On score reports, College Board emphasizes what it calls the “Nationally Representative” percentiles. It estimates what the percentiles would be if every student took the exam. The students who actually take the exam have a higher performance than the nationally representative sample, and the Commended cutoff is based on actual test takers. Also, if the percentile is based on your student’s total score, it may not reflect how the Selection Index gives twice the weight to the ERW score versus the Math score. Also, I’m assuming your student is a junior. If your child is a sophomore, then the scores are only being compared to other sophomores, and National Merit is not a concern until this October’s PSAT.
Hi Art, do you think a 217 in Florida will make the cutoff?
Ann,
The best answer I can provide is that it has a better than even chance of qualifying. The cutoff is almost certain to go down this year, but I don’t think 216, 217, or 218 are out of the mix. Obviously, only the 218 would be a problem. Unfortunately, we’ll be waiting until September to find out the correct answer.
Please disregard my previous reply. I was reading it incorrectly. I believe you are saying if it ends up being 218, that would be the problem. Correct?
Correct. I just meant that at a cutoff of 216 or 217, everyone scoring a 217 is happy.
Hi Art,
I’ve got four questions for you:
1) Thoughts on a 216 in Arizona?
2) How do colleges “know” PSAT scores, since I’ve gotten mail saying how well I did on the PSAT?
3) Are there any scholarships for a commended student?
4) How do you think Coronavirus will affect the National Merit timeline?
By the way, thank you for your insightful reports.
1) I think we will see some state cutoffs move down by 3 points, so 216 could happen in AZ.
2) College Board makes a lot of money selling lists to colleges (you checked a box to allow them). Colleges will buy up lists based on ranges. “I’d like all of the students in AZ, NV, and CA scoring above 1300 who mentioned an interest in engineering.” It’s a way for them to target their marketing.
3) I have run across a handful over the years, but I’m afraid that I can’t cite any.
4) Counselors are working remotely, but they are still working. So schools should be able to get NMSC the information it needs. I am hoping Semifinalist announcements stay on schedule. If SAT and ACT dates continue to get canceled, I could see a chance of SAT/ACT being dropped as a requirement at the Finalist stage. I don’t think it will come to that, but anything is possible at this point.
Hey Art,
In regards to your 4th point, what do you think could be the finalist requirement be in that case? GPA? Extracurricular?
Thanks,
PN
PN,
Academic performance (NMSC doesn’t specify GPA, and I don’t think it will) and a recommendation from the school have always been Finalist requirements, but I doubt that extracurriculars would be a factor at that stage — it’s too soft of a criterion. I’m very hopeful that SAT and ACT will be back in time, especially now that each has committed to remote proctored exams if schools continue to be closed in the fall.
Hi Art
Any conjecture on a 213 in Louisiana ? Thanks.
Olivia,
Louisiana ranges between 3-5 points above the Commended level. My “Most Likely” is in the middle of that range at 213. I think the odds are maybe a just better than even that a 213 will qualify.
Art,
220 in Kentucky. Looks good based on what I’m reading here. Can you reassure me?
Thanks,
Ari
Ari,
I can reassure you. Kentucky has never been close to a 220 cutoff, and it certainly won’t be this year. Congratulations!
What do you think of chances for 219 in DC?
Thanks.
Amy,
It’s so tough for DC students, because the District ends up having the cutoff of the state with the highest cutoff. I don’t think we’ll see every state fall that much.
Thanks. That’s too bad. But this methodology seems to set a really high bar for dc students, especially the DC public school students (DC residents) who are competing against the kids from Maryland and VA attending DC’s fancy private schools/. I don’t think there are ever more than a handful of DC public school winners every year..
Amy, you’re absolutely right about why the DC cutoff is so high. While I don’t have data to prove it, I’ve heard that it would be even higher if it were not pegged to the highest state cutoff.
Hi Art, Our daughter has PSAT score of 220 from Texas . What are the chances of being a semifinalist?
Susan,
Her chances are quite good. Given all that we’ve seen, I think it is unlikely that many states see the same cutoff this year as last. I’d say at least 80-90% chance.
Hi Art – Thank you for all of the valuable work. Inane question, sparked by Corona-boredom, but: 222 in New York is >99% safe to qualify as a Semifinalist?
Thanks
I think we can go ahead and put that at 100%. Stay well.
Hi, my child scored a 211 index in Mississippi, what do you think his chances are?
bw,
I think we’ll see a number of state cutoffs fall by 3 points this year, although I do think that 2 point changes will be a bit more common. Mississippi has come in two points above the Commended level on several occasions, so a 211 is definitely in range.
Given the drop in commended cutoff from last year, what do you think are the odds for a 218 in Florida?
Josh,
I think we’re likely to see 80-90% of cutoffs go down this year. There is an excellent chance that Florida will be among them, especially since larger states are less likely to have out-of-the-ordinary bounces. So I like the odds of a 218 qualifying.
Got a 218 in florida. What do you think my chances are? How likely is it to drop from a 219 to 218?
Rohan,
I think we will see most cutoffs across the country dropping by at least 1 point. We can’t say with certainty that Florida’s cutoff will be 218 or lower, but I think there is an excellent chance.
I have a 219 index (in Washington state) so crossing my fingers that I qualify! Thanks for your very informative article, it helps to calm (some) of my nerves 🙂
Best of luck, Hanna!
Are the chances of a score of 220 making national merit semifinalist in virginia high?
Sri,
Virginia is always one of the most competitive states, but we will likely see its cutoff drop. I think there are roughly even odds that it will fall to 220 or 221.
hi
my child scored 222 in California – (class of 2021). what are her chances?
Dinesh,
Excellent. I will be dumbfounded if California comes in at 223.
Hello Art,
Now that the Commended Cutoff is known to be 209, is a 212 for AL likely out of the running for semi-finalist? Thank you for your insight.
Dawn,
While a 4-point drop would be unusual, this is an unusual year. I wouldn’t give up hope!
I have truly appreciated your posts and thoughtful responses to your readers! I had put NMS on the “back burner” after my junior son received a 217 index here in North Carolina. The information you posted about possible cut off numbers has certainly reenergized my research. I never would have considered a 2 point drop as a possibility! Wow.
Realizing that he is still very much on the bubble, I have a question relating to the semi-finalist to finalist stage. Can you shed light on the mysterious 1000 person drop that seems to happen outside of the application portal?
Thanks, again!
JSP,
NMSC does keep that a bit mysterious. The criteria are stated, but not with any level of certainty.
(1) Some students don’t bother applying. Yes, in some cases students are not concerned about reaching Finalist stage.
(2) Some students do not receive a recommendation from their school. Now is not the time to pull a prank on a principal.
(3) Some students do not earn a confirming score on the SAT or ACT. The score is not usually determined by this point, but will fall right around the Commended level (use the same formula to create an SAT Selection Index). See our FAQ for the more complicated explanation for ACT scores.
(4) Some students don’t have a transcript that supports their bid. This is the squishiest one. There is no GPA cutoff. C’s supposedly can be a problem. I have no idea what NMSC will do about all of the P/F grades this year.
Hi Mr. Sawyer,
My son scored a 220 in Virginia, how would you place his odds of qualifying for national merit? I.e. do you believe 221 or 220 is more likely?
R.,
I would put them at even odds. We know that Virginia is likely to come within a point or two of the highest cutoff, but there is no certainty yet over where that top mark will fall.
Hi Art,
how likely is it that a 218 in Arizona will get me SemiFinalist?
Josh,
I think we’ll see 90% of cutoffs go down this year (100% is not out of the question!). So while we don’t have specific information on Arizona, I’d be optimistic with a 218. Good luck.
Do you think a 219 will be good enough for Semifinalist/Finalist in PA?
Also when they choose the Finalists out of the Semifinalists, if all other criteria is met, do they choose the highest scoring Semifinalists to become Finalists?
Jiangfeng,
Given what we know, I think it is unlikely that Pennsylvania’s cutoff will stay at 220.
No, scores are not a deciding factor. The Semifinalist to Finalist stage is about meeting the criteria.
Hi Art;
So nice of you to answer all these questions during these trying times. We originally thought my daughter missed the cutoff but do you think with a 220 in NY she will be a semi finalist?
DT,
A 220 is in a range where we can’t know for sure, but I do believe that most state cutoffs will see at least a 1-point decline. Your daughter’s chances are good. Stay safe.
Hi Art, thank you for writing this very informative article.
I got a 222 in Maryland this year, which is usually right on the border. Seeing how circumstances have changed, is it likely that this score will qualify?
Evan,
Everything I’ve seen points to falling scores this year, so I don’t see much chance of Maryland moving up to 223. You have an excellent chance of making NMSF.
Hello.
I got 222 in NJ, what do you think r my chances?
Also, if there are 10 kids in the grade that made the cutoff how the school choose? and for the distinct honor, what is the cutoff?
Thank you!
Ben,
I like your chances at 222. If any state sticks at 223, it will be NJ, so I can’t say that 222 is 100%. The number of high scoring students at your school does not impact NMSF selection. Even at the Finalist stage, there is no need for a school to favor one student over another — most like the bragging rights of having Finalists. The Commended Student cutoff is 209 this year.
Thanks so much for all the helpful info! My Son has a 220 in Texas and we are crossing fingers. How do you think COVID issues will affect National Merit this year? My son already has a qualifying SAT score but wondering if they will have to adapt that measure? Also with the test optional movement occurring – will this have any impact on national merit?
Gina,
If test dates keep being cancelled, NMSC will need to reevaluate the confirming score requirement. Students can earn that score as late as December, so there is still time. The great news is that your son doesn’t need to worry about that! The confirming score is only relevant during Finalist selection, so no adjustments will need to be made for NMSF. I don’t see COVID issues impacting National Merit that much this year (PSAT cancellations would dramatically change the landscape for next year’s class). Colleges that are already committed to sponsoring scholarships are unlikely to back out this year just because they have temporarily gone test optional. I don’t know if the economic fallout will mean fewer company sponsorships.
Has the commendation score for the class of 2021 been officially released? Is 209 the official commendation cut-off, or is that not confirmed until this Fall?
Hi Ashley,
College Board won’t release the Commended cutoff to the public until September. However, they provided some Commended notifications in April, and we have confirmed that 209 is the cutoff sore.