
An opportunity missed.
College Board has used lofty language to describe its goals for the new SAT—equity, fairness, college and career readiness. It announced the test redesign in 2014 as part of a “renewed commitment to delivering opportunity,” however, without stating how it would provide confirmation of delivery. College Board has made moves to bring additional opportunity to students—its partnership with Khan Academy and its commitment to expanding the availability of fee waivers stand out as two examples—while largely avoiding the topic of gaps in subgroup performance. This article is meant to challenge this silence and demonstrate how the changes to the SAT had a negative impact on female test-takers.
This piece is more akin to a research report than to a regular post. For those desiring a shorter, less sober view on this topic, I recommend starting with “The Disadvantaging of Female Testers: A Reproof of College Board.”
First do no harm.
Differential performance on the SAT across subgroups—gender, race and ethnicity, and income, among others—has long been an area of concern for critics of the test and for College Board itself. During the prior revision of the SAT in 2005, College Board made a remarkable pledge, as summarized in its 2007 report “A Historical View of Subgroup Performance Difference on the SAT Reasoning Test,” by Kobrin, J. et al..
Whether College Board made the same pledge for the new SAT (2016 edition) and failed to live up to it or whether it abandoned the promise altogether, the result is the same. An analysis of scoring differences shows that at least one group—high-performing female test-takers—has been disadvantaged by the new exam. Evaluating this claim requires data, methodology, and patience. Expandable notes are available along the way for those with even more patience.
Scores, like cats, must be lived with for several years before they are understood.
The reworking of scores means that colleges, counselors, and students have a more difficult time interpreting them. Concordance tables can be used to match up individual scores, but what does it mean that the difference in average SAT scores between males and females on the new SAT is 20 points—1081 for males and 1061 for females? Is that better or worse than the 24 point difference on the old SAT—1503 versus 1479? Does it matter that the new SAT’s difference increases to at least 40 points when looking at male versus female students with above average scores? Should it be expected or disheartening that proportionally 45% more males are in the 1400-1600 score range than females?
This article addresses these questions primarily through comparison. The author is not equipped, for example, to answer the final question, because it delves into a more complex discussion of, among other things, scholastic performance versus test performance, gender stereotypes and expectations, and curricular, construct, and predictive validities. There is an extensive body of research on these topics.
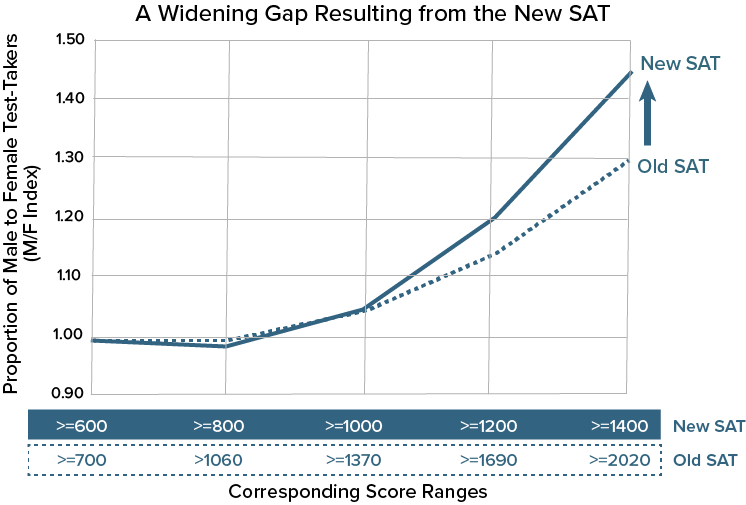
By exclusively evaluating the new SAT in comparison to the old SAT, a narrower question can addressed. To borrow the language of Kobrin, et al.:Did gaps in performance widen?
The graph below shows the widening of performance gaps as one moves to higher scoring groups of students. The College Board’s own research can often minimize these differences by looking at the middle of the distributions. This graph will gradually be unpacked over the course of this report.
Blurring the SAT’s mission
An evolving change in the SAT’s mission has created a certain dissonance. With the SAT’s repositioning as a test of “college and career readiness,” there is added emphasis on curricular standards, benchmarks, and expanding the pool of test-takers to provide a pathway of opportunity to all students. These are laudable—probably essential—goals, but there is an imperfect match with the traditional use of the SAT as an admission exam. For many students, readiness is not all. They do not show up bleary-eyed on Saturday mornings to prove that they have “a 75% or greater likelihood of earning a C in the first-semester of a credit-bearing course in a related subject” (the definition for math and reading benchmarks on the SAT). They want to get into the colleges of their choosing, and doing well on the SAT can help them meet that goal. Relative performance matters in the case of admission, and to disadvantage or ignore female students—or other subgroups—seeking competitive scores violates the principles of equity. College Board should not be allowed to ignore these students, and its rhetoric often does.
A simple change with complex consequences
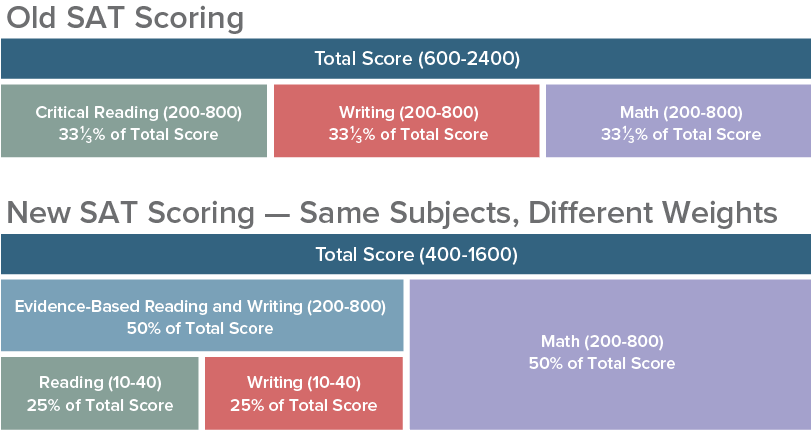
Perhaps the most fundamental shift on the new SAT was not one of subject matter but of scoring. Reading, writing, and mathematics are still tested separately, but the most commonly used SAT scores — the familiar 200-800 ranges — now combine the reading and writing measures into a single Evidence-Based Reading and Writing (ERW) score. This change allowed College Board to return to 400-1600 scoring after a decade of 600-2400 results. David Coleman, president of College Board, made this announcement in 2014 as an applause line—a sort of nod to the glory years when the SAT was still the leading college entrance exam. The 1600 scale, though, has been a key contributor to the widening gap in male and female score results.
College Board stopped reporting full percentile information by gender with the class of 2015 and removed even score range comparisons in its 2017 annual report on college-bound seniors. Much of the detailed historical data has also been excised — either by intentional or haphazard pruning. Fortunately, some of that information has been archived or is available from alternate sources.
The numbers College Board didn’t publish.
Expand for a note on data sources and comparisons
Comparing like-to-like data runs into multiple challenges. For several years, College Board and ACT followed a policy of releasing data for a class based on the tests taken through June of the graduation year. For the class of 2016, College Board truncated the data at January of senior year in order to avoid mixing old and new SAT results. This had the effect of making the 2016 report something of an outlier. The 2015 report has more data—crucially, complete percentiles by gender—and is more typical of a full cohort reporting cycle, so it is used here as a measure of the old SAT.
College Board’s annual report on the class of 2017 faced the problem of how to report on students who stopped testing with the old SAT. It ended up simply dropping those 124,000 students and reported on the 1.72 million who took the new exam. This had the effect of lowering reported scores when compared to a full class year. Students who take the SAT earlier tend to be higher scoring. Students who wrapped up testing with the old SAT often did so because they were satisfied with their scores. While not published with its annual report, College Board does track the 2017 cohort as a group and concords old SAT scores to new SAT scores for the extra 124,000 students, 53% of whom were female (essentially the same proportion as in the total group). The figures in this article use the full 1.83 million students who took the old or new SAT. This number (a) better reflects the entire cohort and (b) is the only option for comparing male and female score results unless College Board returns to publishing full data tables. The figures presented here do not match directly to the published class of 2017 report because of the different definitions used. As an example of the difference, College Board reports that the 1.72 million students who took the new SAT averaged a 1060. The data on the 1.83 million students reflects a class year average of 1070 once concorded old scores are included. The author does not believe that any of the conclusions would change based on the different pools of students.
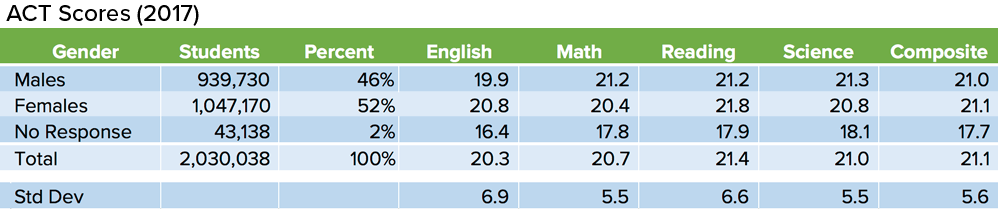
While this article questions some of the College Board’s decisions about data release and research, it should be noted that ACT has not regularly (has never?) provided detailed performance statistics by gender. Instead, it has relied on reporting mean scores, which can disguise important differences in subgroup performance.
Calculating the ratio of male to female testers.
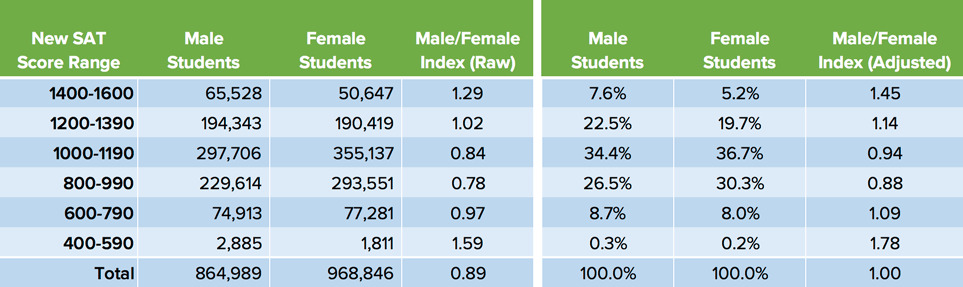
In absolute and percentage terms, males are more represented in the upper and lower score ranges. A simple measure of score differences is the ratio of male to female testers at a given score band (referred to here as the Male/Female Index – Raw). For example, 65,528 males scored 1400 or higher, while 50,647 females were at or above that score, for an index of 1.29.
Two refinements of this ratio are useful. More females take the SAT (they represent about 53% of test-takers). Note that the overall Male/Female Index – Raw is 0.89. Comparing the percentage of male and female students rather than the raw counts adjusts for this difference and allows for a discussion of proportional results. In the example used above, 7.6% of male test-takers were in the 1400-1600 range. For female test-takers, the figure is 5.2%. The ratio of 7.6% to 5.2% is 1.45 [the exact percentages have been rounded for presentation.] This figure is referred to as the Male/Female Index (Adjusted). The adjusted index is favored by the author for its reflection of proportional results. Were the raw index used, instead, the results would remain the same in both direction and magnitude, because the percentage of female test-takers changed little from old SAT to new. Unless otherwise noted, “M/F Index” will refer to the Male/Female Index (Adjusted) for the remainder of this article.
Another refinement is to look at cumulative performance. Rather than isolating individual bands, the cumulative percentage allows comparison of students at or above a given score. This better reflects how students interpret scores. “I am In the top one-third of test-takers” is a more likely statement than “My score puts me between the highest 12% and 33% of results.” It also avoids the statistical problem that high representation in one band can mask a drop in representation in another.
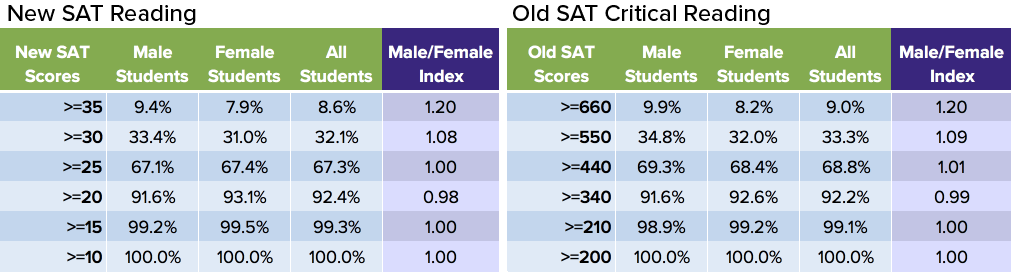
The tables below compares the results from the new SAT and the old SAT.
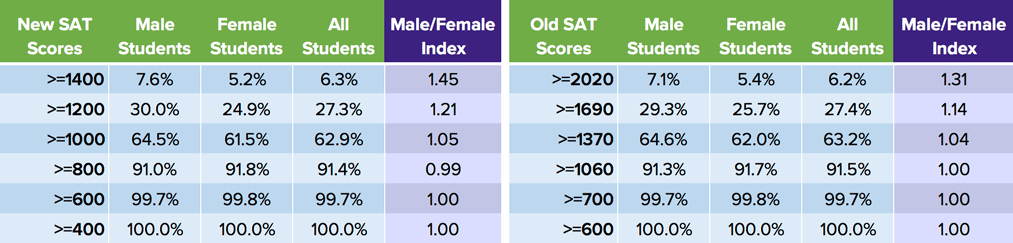
The table shows that 30% of male students (7.6 + 22.5 = 30.1) scored 1200 or higher on the new SAT. The equivalent figure for female students is 24.9%. The M/F Index for that group of students is 30/24.9 = 1.21. The data demonstrate that the change in exams has shifted results in favor of high-scoring male test-takers. The M/F Index increased from 1.31 to 1.45.
Indexes can seem abstract, but had the new SAT maintained the same gender differences as the old SAT, the number of female students in the 1400-1600 range would have been approximately 7% higher than it actually was.
Interpreting the M/F Index
By the time scores approach the means of each test [1070 on the new SAT, 1490 on the old], both exams see M/F Indexes that approaching 1. The number of students—especially females—in the middle of the curve start to outweigh differences at the top.
A M/F Index of 1 indicates the same proportion of male and female students at or above a given score. It is tempting to think of a constant value of 1 as the ideal level. In practice, no academic test performs identically on every subgroup at every score level. Further, the makeup of male and female testing populations should not be assumed to be identical. Self-selection can play a role. The fact that more females choose to take the SAT and to attend college may produce a more diverse group of test-takers. These caveats do not imply that testing organizations have no duty to monitor and assess the fairness of their exams, especially when it comes to the widening of gaps. An assumption of the analysis here is that the population of test-takers for the new SAT is similar to that of the old SAT. This is an assumption commonly made by College Board in its own research.
Linking old scores to new
The change in SAT scoring introduces the problem of how to compare new SAT ranges to those on the old SAT. Why, for example, are scores 1400 and higher on the new SAT compared in the table above to those 2020 and higher on the old SAT? Score bands were created by matching— as closely as possible—the percentage of all students across the old and new exams. For example, 6.3% of testers scored between 1400 and 1600 on the new SAT, whereas 6.2% scored between 2020 and 2400 on the old SAT. On the new SAT, 27.3% score at or above 1200, which compares to 27.4% that scored at or above 1690 on the old exam. The ranges can be said to be (approximately) equipercentile. This linking is necessary because scores cannot be transformed through a simple equation such as new = two-thirds old.
Expand for a note on the use of concordances
Concordances are a method of linking exams that measure similar skills. The ACT and SAT have long been linked via a concordance so that colleges can compare students submitting either exam. College Board developed an equipercentile concordance to compare the new SAT and old SAT. This article, however, does not use that concordance.
A concordance is typically developed by having the same group of students take both exams and matching the percentiles across the exams. College Board did this in a pilot study completed before the new SAT was actually administered and, critically, has released little information about the pilot. In choosing between a measure that can be analyzed and shared (the performances of the classes of 2015 and 2017) versus one that requires faith alone (the College Board concordance), the author has chosen the visible. Concordant scores were also examined and were shown to produce almost identical M/F Indexes.
Did the restructuring alone increase the observed differences or did other changes play a role?
The most obvious explanation for the the overall widening of the score gap is the increased weighting of the subject with the largest gap—Math—and the decreased weighting of the subject with the smallest gap—Writing. Analysis shows, however, that test construction decisions made even within a particular subject area can and have shaped subgroup performance. The gap may widen or narrow based on what is included, what is excluded, and how things are packaged and assembled.
The math on Math. A decrease in the M/F Index.
Math continues to have the highest M/F Index, and Math’s weight has increased from one-third to one-half of the total score. The math on the SAT, however, has not been static. College Board dramatically overhauled the exam. Geometry fell out of favor. Algebra got an added embrace. Much of what had fallen in “Numbers and Operations” got pushed aside for probability and statistics. Real world application of concepts came to the fore. Below is a table comparing new SAT Math performance to old.
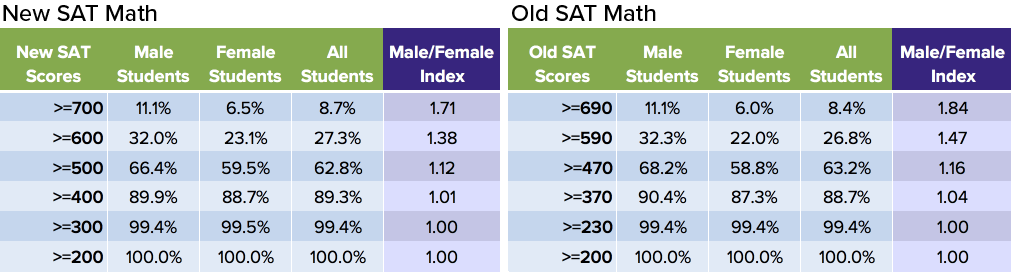
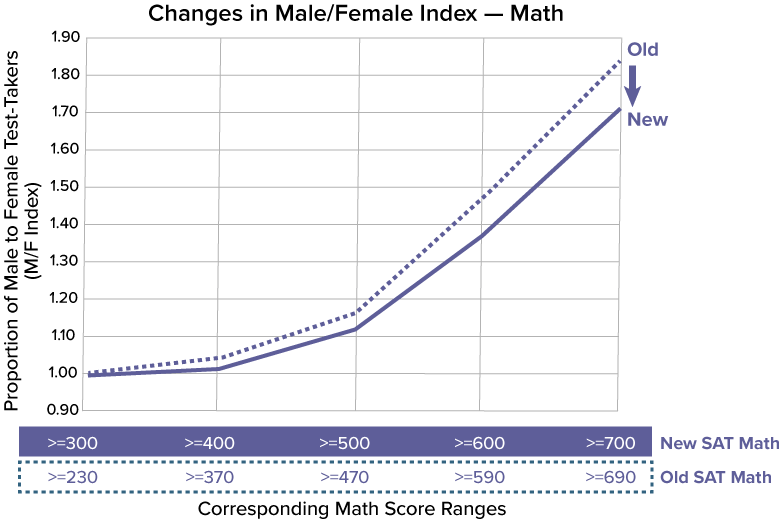
The net impact of the changes was to lower the M/F Index for math (note that the solid line of the new SAT falls below the dotted line in the graph). Proportionally, the number of females in the upper scores of the exam increased rather than decreased. When the SAT changed in 1994 and again in 2005, researchers did not find a significant change in the gap between male and female students, so this could represent a new development. However, the methodologies are not directly comparable. The College Board researchers depended on standardized mean differences between exam versions. That measure looks at the difference of mean scores divided by the standard deviation. It does not separate out higher than average scoring students as done here. Standardized differences can disguise important gaps.
Do Math subscores explain the change in the M/F Index?
The new SAT provides three subscores: Heart of Algebra (what roughly might be thought of as Algebra I), Passport to Advanced Math (Algebra II), and Problem Solving and Data Analysis (Probability and Statistics). Unfortunately, College Board’s decisions on scoring have made the subscores difficult to compare. They are provided below for completeness.
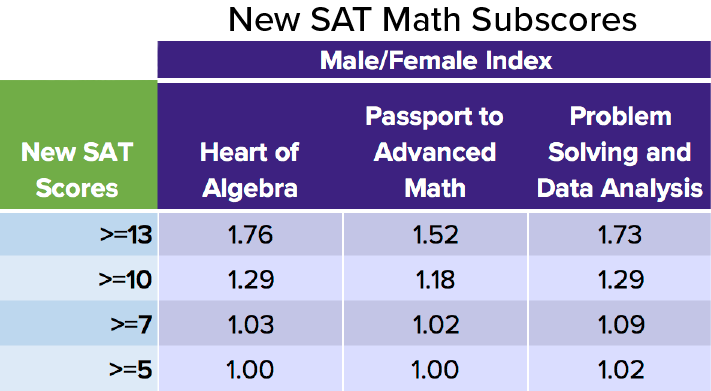
The inherent problem in the SAT’s subscores is that College Board has not advanced a unified theory of scoring. For example, it has not scaled scores so that there is a common mean and standard deviation. Or it did so using a pilot group that was ill-matched to the actual population. The result is that the percentage of students in a score bucket is different across each domain. Passport to Advanced Math has the greatest number of students in the 13-15 range, which may also account for the lower index. The technique used to compare new SAT and old SAT— matching percentiles—is not available, because the released data are not granular enough.
Why did the proportion of high-scoring female students increase on the new math section?
One theory is that the new SAT’s effort at academic alignment made testing performance more similar to performance in school. Researchers have consistently found that female students have higher high school and college GPAs than their male counterparts. Whether it is high school algebra or college calculus, females with the same SAT scores as males achieve higher grades. On tests such as the NAEP and ACT Mathematics, the standardized differences (male minus female means) are also lower than they were on the old SAT. In fact, the standardized mean difference (see more below) for the new SAT Math falls between that of the old SAT and the ACT.
The change in performance and the differences across subject areas and exams serve as reminders that there is not a monolithic “math” ability. Computational, conceptualization, visualization, and verbal skills, for example, can all impact how students perform. Which content standards to include and how they should be tested are decisions made by committees and are not fixed stars.
When looking at individual problems on an exam, psychometricians analyze “differential item function” (DIF) to spot questions that are outliers subgroup performance. When the entire test is being changed, though, the very definition of an outlier is ambiguous.
Separating reading from writing
The 200-800 ERW score obscures the divide between Reading and Writing and Language scores by summing them. Fortunately, test scores (10-40) are also provided in each area. Unlike subscores, which have no analogues on the old SAT, test scores can be linked via equipercentile equating to the old SAT’s Critical Reading and Writing sections (200-800).
The M/F Indexes for new SAT Reading and Writing scores are presented as solid lines in the graph below. The old SAT indexes are the dotted lines. The divergences of the solid and dotted lines reflect changes in the proportions of male and female test-takers in those score ranges.
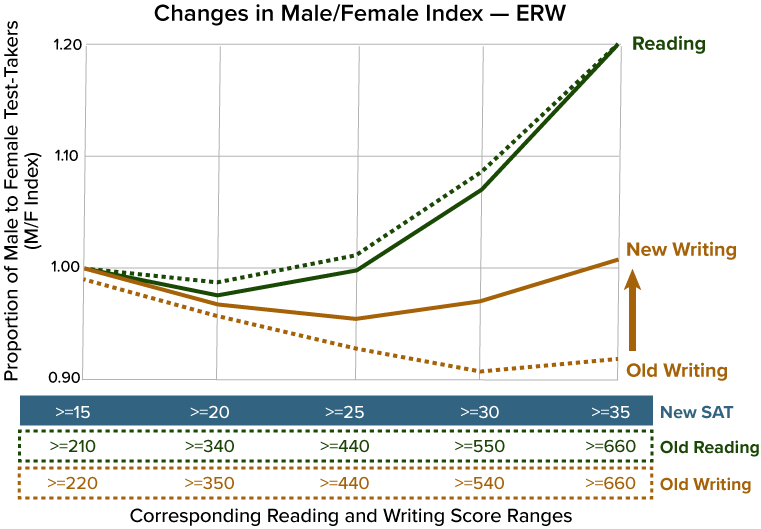

While the changes in M/F Indexes for Reading are small, the shift in Writing scores is similar to that observed on the Math section. The crucial difference is that the shift is in the opposite direction. On the old SAT, the Writing section was the only score where the M/F Index was less than 1 in the top score bands (i.e. proportionally higher female representation). On the new exam, the Writing and Language index is now over 1 (proportionally higher male representation). This would equate to approximately a 5% decrease in female students in the top band versus the old SAT.
What writing modifications account for the change?
Subscores did not exist on the old SAT, so the change in writing scores cannot be definitively located. A partial explanation may involve the removal of the essay from the Writing section. Female students outperformed male students on the original SAT essay, which represented almost one-third of the 200-800 Writing score on the old exam.
Summarizing the changes
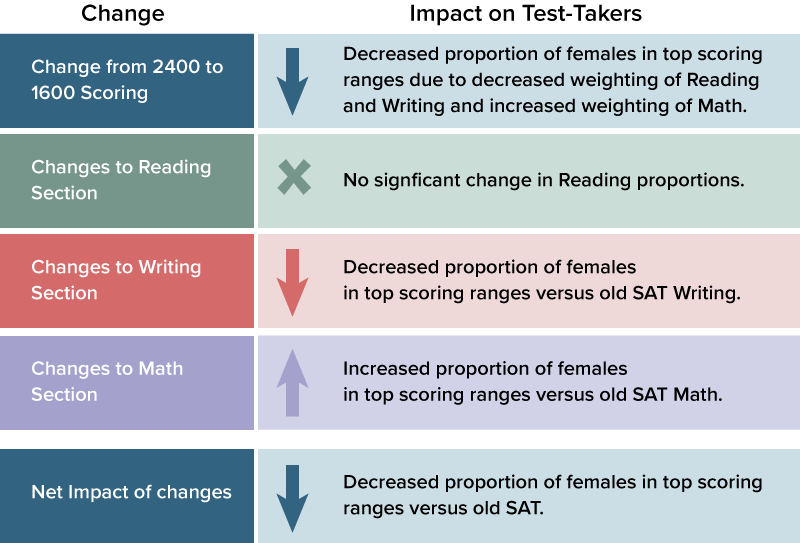
The Impact on Admission
The percentage of female students in the top score ranges has decreased on the new SAT. The impact of this change does not automatically flow through to college admission. High school GPA is still the dominant admission factor, and selective colleges tend toward holistic evaluation of applicants. Moreover, colleges are not restricted to using scores in a set manner. They can apply differential weights to section scores, for example. The impact of the test changes on female applicants seems a ripe area for study by College Board and universities.
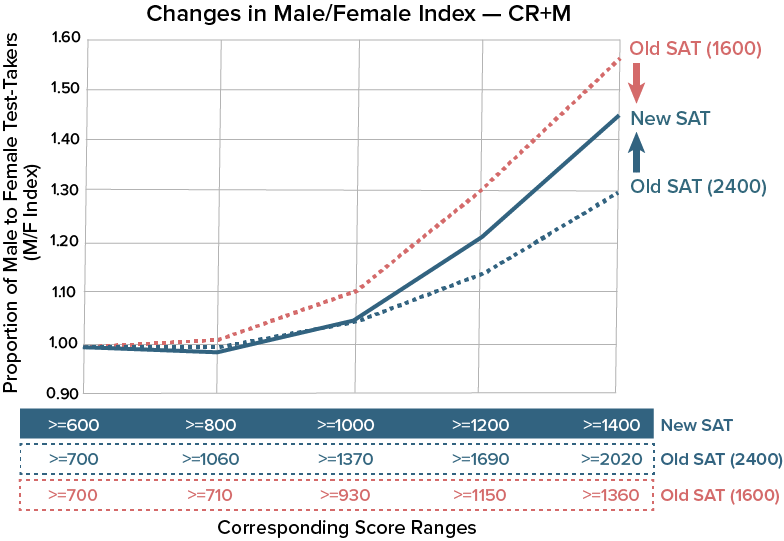
Some colleges never adopted the old SAT’s 2400-scale in full and used only the Critical Reading and Math sections (1600, CR+M). In these situations, the direction of change is reversed and the Male/Female Index moves from 1.56 to 1.45. The shift in the M/F Index for new SAT Math and the addition of the Writing and Language component (even if just as ¼ of the total score) increase the proportion of high-scoring female students in comparison to a CR+M test. In this specific case, the gap narrowed compared to the new SAT.
The unintended consequences of cut scores
Colleges that use cut scores for admission or scholarship decisions may have unintentionally shifted resources to male students this past year. Most such colleges adjusted their cutoffs for the new SAT by applying the College Board’s concordance tables. To the extent that the old cut scores were based on 2400 scores and the new cut scores based on 1600 scores, females were impacted disadvantageously. This is especially true where high cutoffs are used—for example, in merit awards or for honors colleges. The results are ambiguous when decisions involve individual subject scores. The National Merit Scholarship Program uses a “Selection Index” cut score from the new PSAT, but the Selection Index retains the equal weighting of Reading, Writing, and Math from the old PSAT. National Merit Scholarship Corporation does not make gender breakdowns available.
Cut scores effectively bound institution-level decisions about the equitable distribution of merit aid or admission to the College Board’s unrelated choices about what standards to include and what scores to weight.
The mission creep of the SAT and PSAT has extended the import of score result differences into new terrain. A popular justification for the early introduction of the PSAT is its use in predicting AP performance. College Board publishes “expectancy tables” by cut score and offers its judgment—on PSAT reports to schools—of a student’s likelihood of success in 21 different AP courses. College Board is cautious in its phrasing of how this information is to be used, but the euphemisms of “Has Potential” and “Not Yet Demonstrating Potential” should not mask the PSAT’s own potential for gender-based steering.
Is the ACT a better test for female students?
It is difficult to write extensively about the SAT without at least bringing up the ACT.
At the group level, the question of whether the ACT is a better test for females is not addressed by enough available research (the “better” part being particularly susceptible to bad research). Standardized mean differences are a way of normalizing scores on different scales. How, for example, does one compare 0.8 points on ACT Mathematics (the difference between male and female scores) and 22 points on SAT Math section? Dividing those differences by the standard deviation of each exam gives the standardized mean differences of 0.15 and 0.21, so the gap in male/female performance is wider on SAT Math. The standardized mean difference on total SAT scores is 0.11, where it is essentially 0 on the ACT. In fact, the average ACT Composite score in 2017 was higher for females than for males—21.1 versus 21.0, and the scores have been close for a number of years.
The problem with this comparison is that it focuses on mean differences and does not examine what happens at the tails of the curve. It also ignores the fact that the population of test-takers cannot be assumed to be identical. ACT’s extensive use as a state-mandated exam can produce a distribution curve different from that of the SAT (although they look more similar with each passing year). Many students have opted for the ACT over the SAT in recent years or are taking both exams. The increase in ACT takers at the high end of the scale (30-36) has been particularly notable. The gender breakdown of these new ACT testers would be interesting, but ACT has not made it available. The limitations produce a watered-down verdict: among students who take the respective exams, the male and female average scores are closer on the ACT than on the new SAT.
At the individual level, the question about an ACT default should be approached warily. Parents would rightly be offended if told that their daughter should avoid AP Physics because male students outscore females on the exam. Group statistics are easily misused or misinterpreted, and standardized tests hardly have an unblemished record in the accentuation of gender stereotypes. The examination of the differences between the old SAT and new SAT can help remind students that, while the SAT and ACT are accepted interchangeably by colleges, test performance is not always interchangeable. The best decision for an individual student is to make a comparison between the exams based on real or practice test scoring.
The danger of insularity and the outstanding questions
The evidence supports the conclusion that the shift from old SAT to new has disadvantaged high-scoring female test-takers when evaluating combined scores. To what degree the shift in score results had a real world impact is the sort of question that College Board should be addressing. A concern is that the increasingly winner-take-all stakes in state-funded testing has made College Board more circumspect about attacking hard problems—and remediating subgroup differences is among the hardest—lest it provide an opening for the ACT. There seems to be an increasing trend toward a tightly controlled narrative and less expansive research.
The decades of scrutiny and criticism of the old SAT had the beneficial effect of making it one of the most researched tests in the world. It is now among the least researched. Its recency means that no peer-reviewed papers exist on the new exam, and College Board has not gone beyond the press release level in discussing subgroup performance. Did College Board apply the same standards it had in the past of ensuring that “gaps that exist on the current test do not widen.?” If not, how does its mission align with David Coleman’s stated goal to “confront the inequalities that surround assessment.” Subgroup performance measurement is fundamental to test design, so research is in a file somewhere. Did it find mold during the renovation process? Were walls replaced? Will all of the blueprints be revealed? What has been done or can be done to prevent recurrence?

Your entire article is based on the assumption that males and females are the same. According to the date above, it certainly looks like there are more “Nobels and dumbbells” among men. Perhaps men have slightly higher visual-spacial reasoning abilities, which you wouldn’t notice in the middle of a distribution, but becomes very obvious at the tails? Why would you ignore such an obvious explanation?
Ryan,
Not at all. I don’t pretend to be able to distill the literature on gender differences and academic and testing performance to a single blog post. What I have tried to show is that the *redesign* of the SAT disfavored female students. Was the change gender neutral in its impact? No, I found that it was not. Was the change a net benefit for female students as a group? No, I found that it was not.