SAT graphics range from familiar bar and line charts to maps, scatter plots, and diagrams. They show up on every section of the test, so get to grips with graphics! Start with our handy guide to one of the most common traps and then work on building these strategies and safety nets into your process:
Watch your time. Before you decide how to answer graphics questions, think about when. If you’ve got a reasonable passage and a complicated graphic, deal with the graphic last. But if you’re running short of time on a tough passage and spot an accessible graphic, jump to it and grab some quick points.
Check the perimeter. Avoid ugly surprises; scrutinize every title, axis label, legend, and footnote. Consider these graphics:
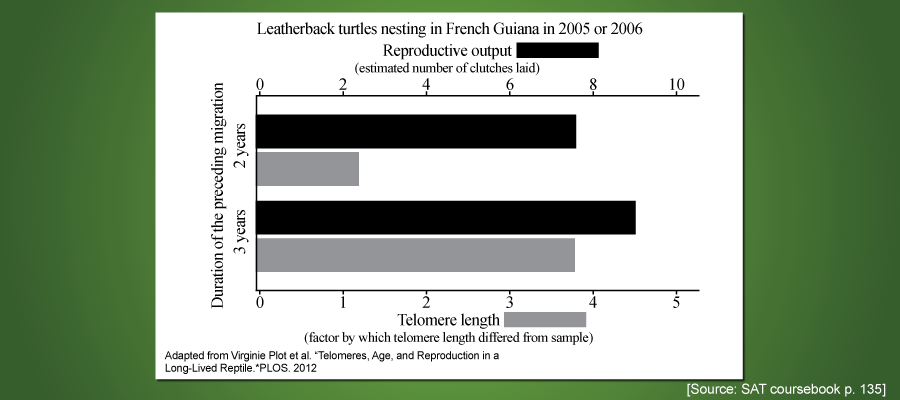
Did you notice that this graph has an X axis at the top as well as the bottom? If you’re asked about the average reproductive output of 2-year-old turtles, you will absolutely be given the trap answer of “4 clutches”!
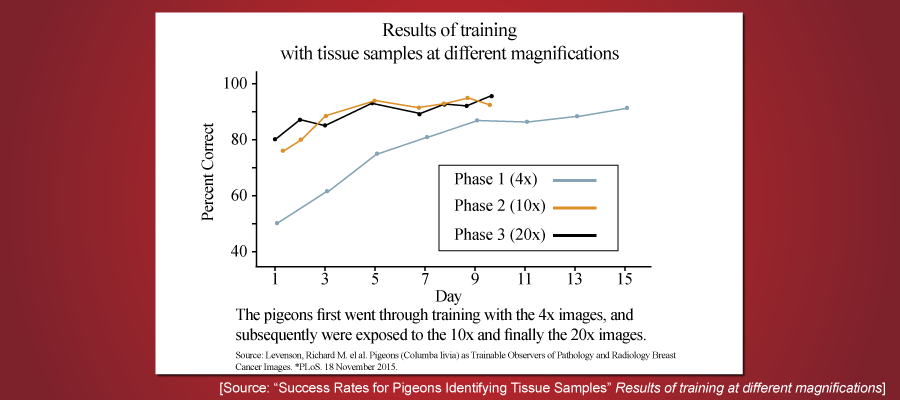
Only the note at the bottom of this graph lets you know that it doesn’t measure the accuracy of three groups of pigeons. This is one group of pigeons going through three rounds of training.
Mark it up. Look for places where things can easily go wrong and mark them clearly—these are the places where the SAT sets its traps. Circle that second Y axis! Mark where that chart’s numbers change from positive to negative! Put a giant star where a number line starts at 12 instead of 0!
Use solid POE. Process of elimination is your best friend on graphics questions. If you mis-read a graph, you can still recover if you keep checking answers and find what looks like a second correct one.
