
Whether it is “hard problems” or “easy tests,” the language of difficulty comes up frequently in standardized testing. While useful in broad strokes, such descriptions are often inadequate in describing what an individual student faces on the ACT, PSAT, or SAT. Students may take the same exam, but the shallows and shoals faced by a 1200 scorer are not the same as those faced by a 1000 scorer or a 1400 scorer. Effective strategy requires that difficulty be defined precisely.
Compass believes in harnessing data and expertise to give students as much feedback as possible. Our recently updated score reports go well beyond the typical Easy/Medium/Hard designations and actually look at precisely how many students at a score level miss a given problem. This peer group analysis — we call it Similar Scorers — allows tutors, directors, and our curriculum team to make far more informed recommendations to students at the question, topic, and section levels. We serve as coaches with a certain amount of practice time and a finite season length. Data mining helps us determine where the practice time is best spent and what techniques will prove most fruitful.
Every score level on every exam has its own unique profile. Below is a Similar Scorers chart for a student, Alex, who scored 600 on the SAT Math section of a recently released exam.
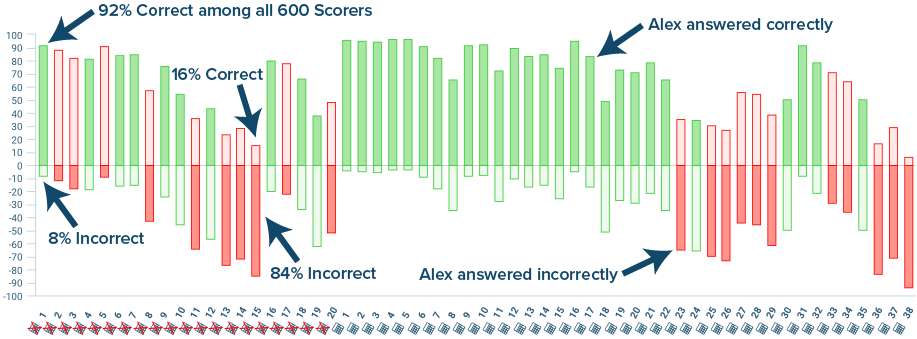
Each bar represents the answers for 100% of students who scored 600. The part of the bar above the axis shows the percentage of all 600 scorers who got this question correct. The part of the bar below the chart represents the percent answering incorrectly. Green bars represent questions that Alex answered correctly. Red bars indicate those that she answered incorrectly. Students who scored 450 or 750 have no relevance to Alex, so difficulty data that includes those scorers would be far less effective.
Not Every Miss Matters
Every problem on the SAT is worth one raw point. Unlike the old SAT and the current Subject Tests, there are no deductions for wrong answers. Isn’t every wrong answer just as costly as another, since it represents missing out on one point? Not really. It’s not uncommon for basketball players to heave up half court shots as time is expiring in a quarter. These shots rarely go in, but the miss is not costly from a strategic standpoint. A missed layup, on the other hand, costs a team an almost certain 2 points. Coaches and players immediately address any deficiencies. The same reasoning can be applied to the SAT. Missing an easy problem is damaging because it should be a guaranteed point. Missing the hardest problem on the test is more equivalent to missing the half court shot.
This is where understanding Similar Scorer data is crucial to strategic planning and to interpreting test performance. I casually slipped in a reference to “easy” and “hard” problems at the end of the last paragraph. Easy or hard for whom? Below is a chart of scoring data for students at Alex’s score point and for those 100 points lower and 100 points higher.
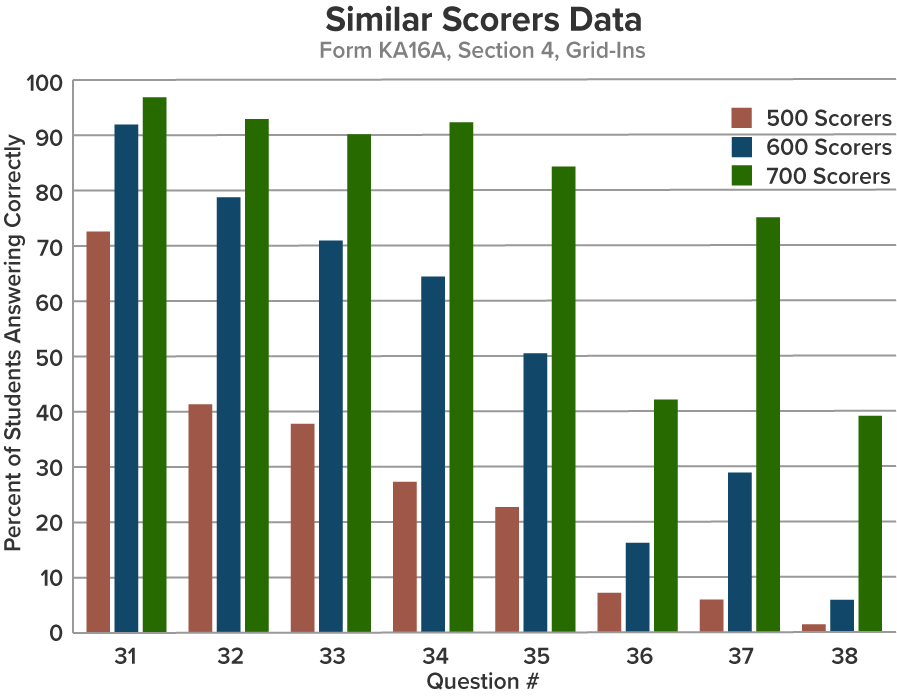 The bars show the results on the 8 grid-in questions at the end of Section 4 of Alex’s test. The questions range from easy to hard, but the differences among score groups are dramatic. On a problem such as #31, there is little distinction between the 600 and 700 scorers, as both groups answer the question at over 90% accuracy. On the other hand, the high scorers do 6 times as well on #38. For 500 scorers hoping to move up to the high 500s or 600, the data show that questions 31 through 35 represent a better opportunity for gains than questions 36 through 38. The average improvement on easier questions — the change in bar height — is almost as much per question as the gain in all three of the harder questions. Students should not be thinking half-court shot when there are still layups to be had. In Alex’s case, it is not surprising that she missed the most difficult grid-in questions. However, she will need to better plan for them if she hopes to move up to the high 600s or 700 range.
In general, Math questions increase in difficulty over a set of problems (multiple choice or grid-in). Reading and Writing & Language questions, on the other hand, follow a passage’s structure, so students can’t depend on problem placement for difficulty clues. Similar Scorers data can help them identify the tip-offs to problem difficulty so that they can learn to adjust their strategy on future tests. Below are the results of Alex’s Writing and Language section, where she scored a 29 (equivalent to about a 580).
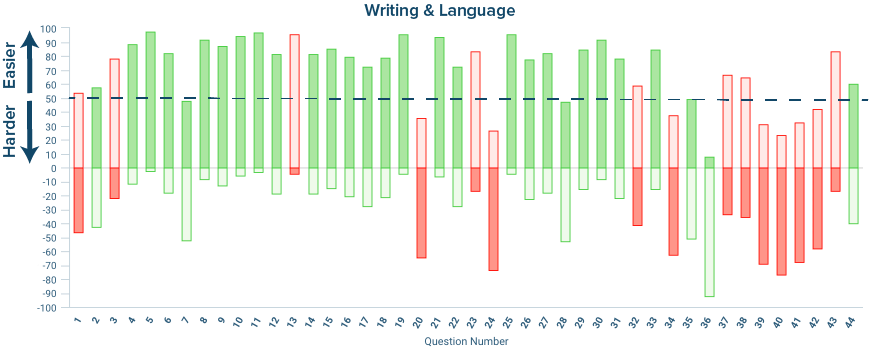 A useful way of identifying the easiest problems that a student missed is to draw in a line at the 50% level as in the chart above. Alex missed 8 questions above that line. She may also want to evaluate the questions below the line — 7 of which she got wrong and 2 of which she got right. Understanding how hard questions operate is a way of disabling traps in the future or, in some cases, avoiding the problems altogether.
The goal of viewing difficulty through the lens of Similar Scorers is to better understand a student’s strengths, weaknesses, and opportunities for improvement. It allows clearer answers to some important questions such as the following:
Where did Alex make the errors that were the most costly?
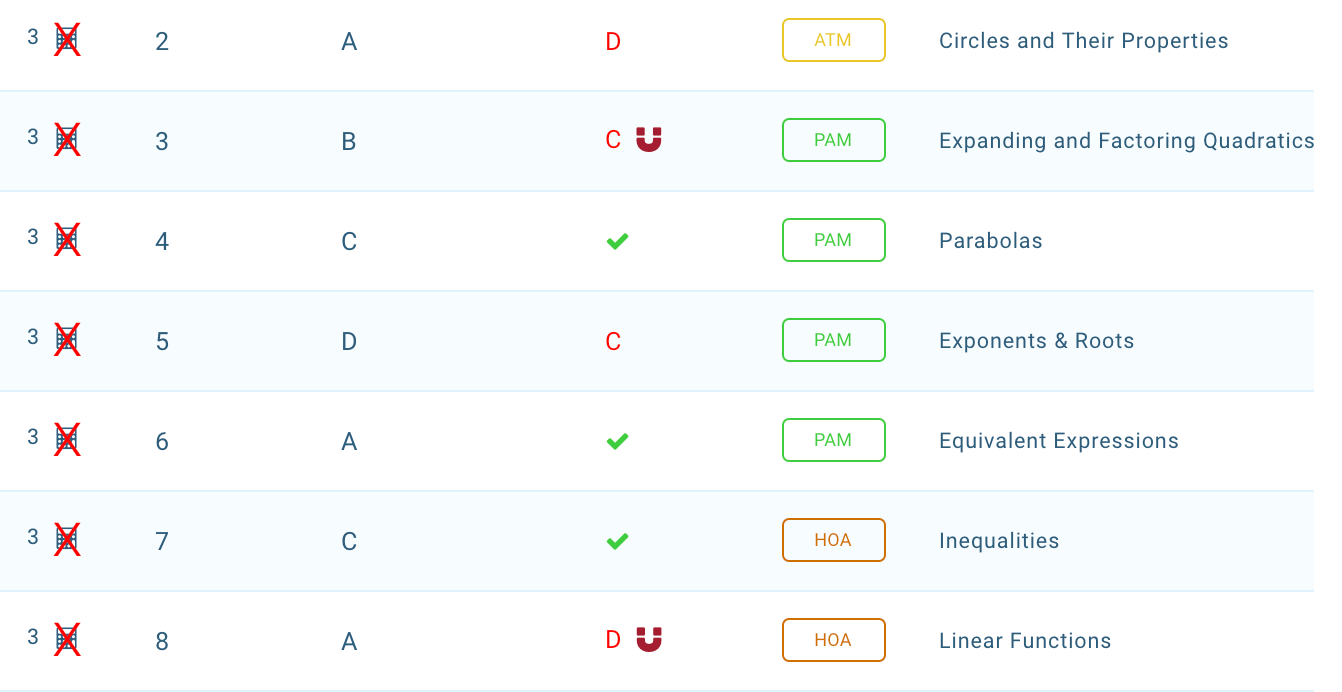
A tutor might be particularly interested in where things went wrong at the outset of the Math-No Calculator section. Alex missed 4 of the first 8 problems, which put her approximately 3 points off pace compared to her peers.
Combining this information with other parts of the the score report can provide even more context. The report detail below shows that she chose the most popular wrong answer on two of these questions (the “attractor” symbolized by the magnet next to her answers). Avoiding these traps would have moved her score up by 20 points.
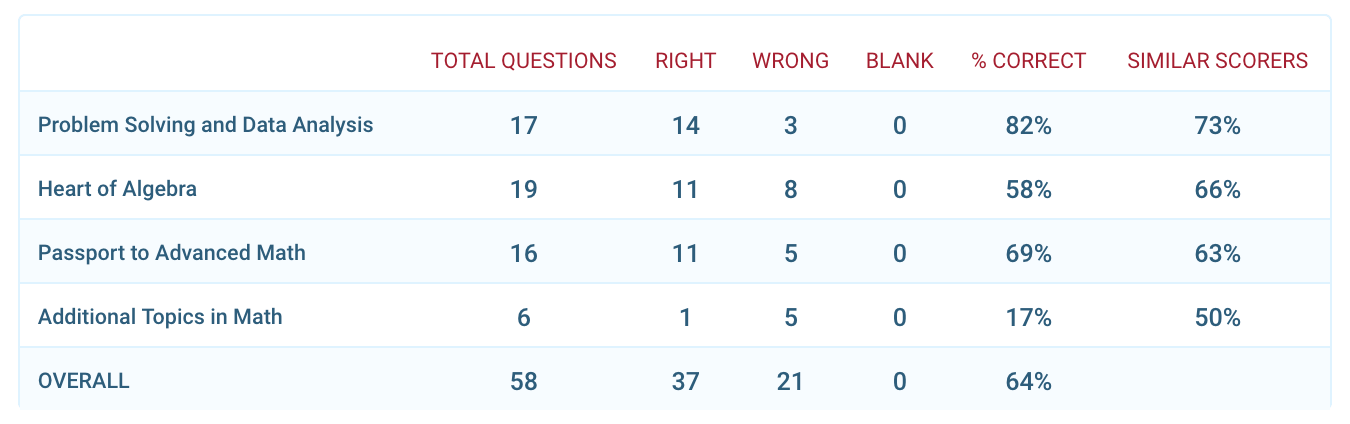
Are there topics where Alex is struggling relative to her peer group?
The Compass score report also allows tutors and students to see the exact topics involved. Is answering 82% of Problem Solving and Data Analysis (PSDA) questions good or bad compared to answering 62% of Passport to Advanced Math (PAM) questions? The student’s relative strengths are best referenced by looking at peer group performance. On both PSDA and PAM questions she was able to outperform other 600 scorers. She lost ground, however, on Additional Topics in Math, which includes geometry. This may just be normal variability, but it can add to a tutor’s understanding of a student’s skills.
Is Alex working quickly enough?
Many students — especially those at the outset of their admission testing cycle — struggle with clock management. Some students have a high success rate on attempted questions but fail to reserve enough time to adequately address the most valuable questions. Others are good at blazing through the test but are more prone to error. Accurately determining where a student falls requires comparing her performance to her Similar Scorers peer group. On both the Writing and Language section and the Math-Calculator sections seen above, Alex seemed to struggle at the end.
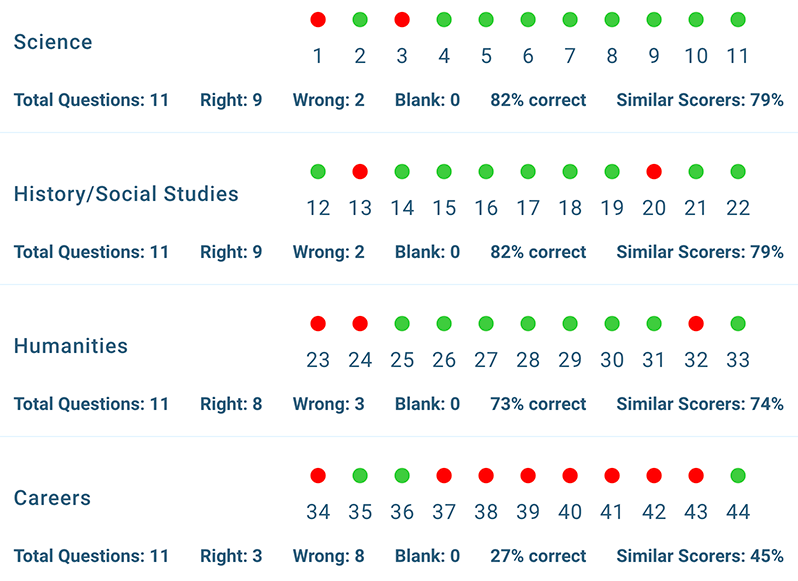
The passage-based sections of the SAT and ACT can be particularly challenging because they require commitment in gulps rather than sips. When does a student move on from one passage and try to complete another? Alex clearly had trouble on the final Writing & Language passage of this exam. The performance of all similar scorers declined to 45% of questions on the final passage, but Alex could only manage 3 correct answers (27%). Below is the score report summary of performance by passage.
The same challenge arises on the final Math section. Alex got every one of the first 19 questions correct, but managed only 8 points on the second half — considerably fewer than her peers. The top row of dots represents the 30 multiple choice questions. The bottom row shows the 8 grid-in questions.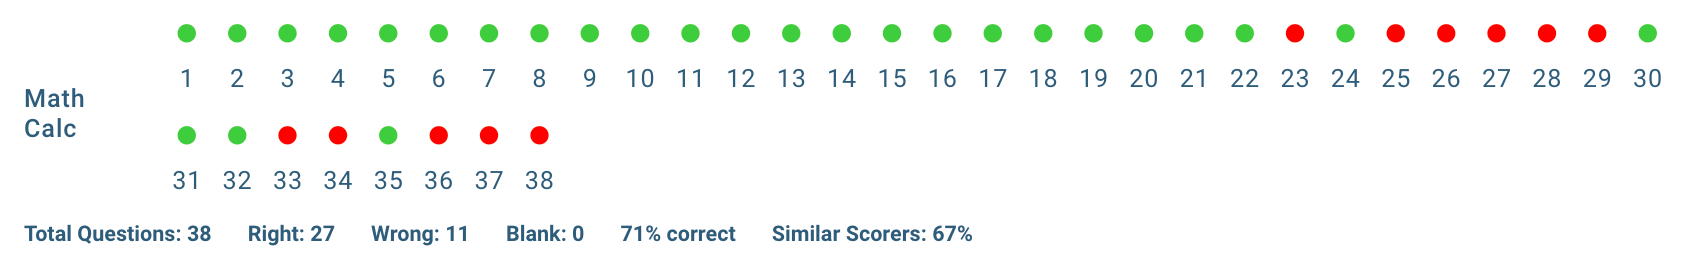
Time management represents a likely source of score improvement as she works on her pacing skills.
How will Alex best meet her goal of increasing her Math score by 60-100 points?
She needs to correctly answer 6-12 more problems to achieve her goal in Math. The guidance provided by each of the preceding insights can aid the student in her plan. She can focus on the problems where she has the best chance of success, understand how she is allowing mistakes to creep in, address content areas where she still needs to improve, and practice her time management skills. She should easily be able to achieve the low end of her goal. Her reach goal will require improvements in both math skills and speed, and it will also require patience.
It’s natural for students to want to get every question right and to immediately imitate the habits of higher scorers. However, a 600 scorer is best served by becoming a 630 scorer on a future practice test and then a 650 scorer and so on. Immediately placing a goal too high can lead to poor strategic decisions. Similar Scorer data help them prioritize and better appreciate the strategy needed to improve their testing performance at any given score level.
