
“What’s a good score?” is the second most common question we hear about Subject Tests—right after “Which subjects should I take?” Students struggle with these two questions because many of their traditional sources of information provide little help. College guidebooks and websites rarely touch on Subject Test scores. There are concordance tables between ACT and SAT Reasoning scores, but nothing that compares ACT or SAT scores to Subject Test results. Unfortunately, students are often drawn to percentiles to judge Subject Test performance, and that happens to be just about the worst place to look.
For example, a U.S. History score of 690 is the 59th percentile and may disappoint a student with a 90th percentile SAT score of 1300 (650 average for Critical Reading and Math). In reality, the student’s performance on U.S. History is excellent. Our analysis shows that his average SAT section score of 650 is a good benchmark for judging Subject Test performance; our student easily clears that mark.
The relationship between SAT or ACT results and Subject Test scores is useful in that it:
- allows students to assess how “good” their scores are relative to their SAT or ACT performance.
- helps explain why 200–800 scaled scores are an effective way of judging performance across subjects.
- helps estimate mean Subject Tests scores at colleges, most of which only report SAT and ACT scores—e.g. a college with a mid-50th percentile range for SAT Critical Reading of 610–660 likely has a Literature score range of approximately 610–660.
- provides educators with a way of gauging student performance for a course or cohort—e.g. if Springfield High’s Class of 2017 has U.S. History scores 25 points lower than the Class of 2016’s, it does not follow that something went wrong in the history class.
Since all available data on Subject Tests involves the old SAT, scores below refer to the old SAT. In an appendix post we cover converting new PSAT scores and ACT scores to old SAT scores. In typical Subject Test score ranges, the differences between old and new are not pronounced.
Everyone in the Pool
Understanding how SAT or ACT scores can provide these insights into Subject Test scores requires a look at how test taker pools shape percentiles and means and how disparate pools can be linked via SAT scores. All SAT students take both Evidence-Based Reading and Writing (EBRW) and Math, so the pools of score recipients are identical. This allows percentiles to provide useful comparisons. For example, a student in the 80th percentile for EBRW and the 60th percentile for Math, can be said to be stronger in EBRW. Subject Tests, however, completely upend this sort of interpretation. The pool of 70,000 students taking U.S. History is different from the pool of 60,000 taking Physics. Both of those pools are very different from that of the 1.9 million ACT takers or 1.7 million SAT takers. Percentile scores for Subject Tests can mislead students into taking the wrong tests or submitting the wrong scores. Percentiles should be crossed out with a black Sharpie so that they don’t serve as a distraction.
Correlating SAT Scores and Subject Test Scores
In order to make use of SAT scores to compare pools of testers, we need to demonstrate a correlation with Subject Test scores. It seems intuitive that Literature and SAT Critical Reading would have a high correlation, and College Board studies show it as high as .84. The correlations between SAT Math and Math Level 1 and Math Level 2 Subject Tests are also high at between .77 and .84. What is more surprising—and more useful—is that SAT scores are good indications of the strength of the test taker pool across a wide range of Subject Tests. In other words, the SAT scores of test takers help explain why the average (mean) scores of some Subject Tests are much higher than others.
Plotting Means and What it Means
The chart below plots mean SAT scores against mean Subject Test scores for 9 of the 10 most popular Subject Tests (Spanish and other foreign language exams are not included, because the varying proportions of native speakers makes direct comparisons flawed). In order to keep everything on a 200–800 scale, the average of Critical Reading and Math has been used. In the case of Math 1 and Math 2 scores, only SAT Math scores are used. For the science and history tests, though, a combination of math and verbal scores better predicts mean Subject Test scores. [Data for this chart can be found in an appendix post.]
Admissions officers have to compare students taking different Subject Tests. Is it acceptable, for instance, to say that a 650 Biology-E is comparable to a 650 Math 2? The relationship between SAT scores and Subject Test scores goes a long way to explaining why it is both acceptable and useful. The Biology-E mean of 625 is 65 points lower than the Math 2 mean of 690, but that is in line with the average SAT scores for the respective pools of test takers of 627 and 693. SAT scores form a kind of bond between scores. Why is this important? Admission officers are able to compare the 200–800 scores without needing to worry that one test is more “difficult” than the other or that the percentiles are “out of whack.” Biology and Math 2 scores will never be truly interchangeable—they reflect ability in different subjects—but as reflections on an applicant’s testing ability, they have a similar validity.
More Supporting Data
One criticism of this analysis is that its inputs are the overall means, and the relationship may not be applicable across the full range of scores. For example, the data show that a mean U.S. History score of 645 is associated with a mean SAT score of 645. Does that prove that a U.S. History score of 500 is associated with an SAT score of 500? The annual data set provided by College Board is not rich enough to make this calculation, but historical results provide some level of confirmation. The pool of test takers has shifted dramatically in the last decade as SAT II: Writing was eliminated and as the UC system dropped its Subject Test requirement. Fewer students take the Subject Tests than did a decade ago, and their average SAT scores are higher (primarily the most competitive colleges have left Subject Test requirements in place). Have both sets of scores risen in a predictable manner? The chart below looks at the change in SAT scores for test takers versus the change in Subject Test scores between 2010 and 2015. [Data for this chart can be found in an appendix post.]
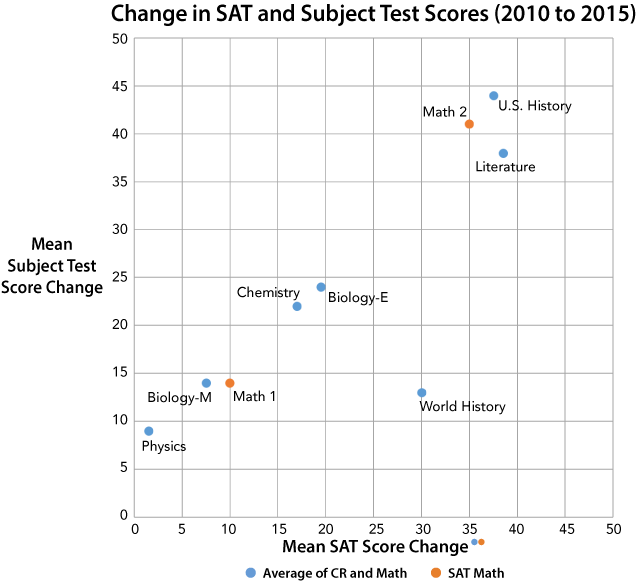
The historical figures are in line with the hypothesis that the SAT scores of test takers help explain differences in Subject Test means. State data provides confirmation for even lower scores. In 2010, for example, California students had a mean Literature score of 534 and a mean SAT section score of 548—an almost identical difference as between the 618 and 631 national scores in 2015.
An Historical Outlier
In looking closely at both scatterplots, there is an obvious outlier—World History. On average, current test takers underperform by 35 points on World History than would be predicted by SAT scores alone. Removing Math from the mix is of no help in explaining the difference. The gap may reflect the difficulty of the World History test, the difficulty in being properly prepared for it, or a miscalculation on the part of test takers. The end result is the same—test takers are more likely to have a low, discrepant World History score than are testers in other subjects. To avoid any unwelcome surprises, we strongly advise prospective testers to take a World History practice test before adding the exam to their line-up.
Questions, Answers, and Limits of the Relationship
It’s important to understand the limitations of this hypothesis. Just because a student obtains a high score on the SAT does not mean that she will obtain a high score in Chemistry. She still needs to know Chemistry. Subject Test results come from self-selected pools of students who have, presumably, felt qualified in their chosen subjects. The data also reflect overall test taker means, so the relationship is more appropriately applied to groups of students than to individual students. A much better solution exists for estimating the scores of a specific student—taking an official practice test (College Board has released at least one practice test for each subject, and Compass can provide a proctored testing environment and scoring for the most popular exams).
Below are examples of how the score relationships help answer real world questions.
- “My 660 Literature and 710 Physics are both in the 58th percentile. Does that mean that they are the same?”
The difference in percentile scores reflects the differences in test taker pools and not how “good” your score is. Coming in 58th out of 100 means something different at a local road race than at an Olympics trial. The difference between Literature and Physics test takers is not that stark, but it is important not to let percentile scores cloud your judgment about Subject Tests.Ignoring percentiles does not mean, though, that the 200–800 scaled scores are the only thing to consider in a testing plan. The scores alone do not factor in what the subjects tell colleges about you. For example, submitting U.S. History and Literature as your only Subject Tests is usually not advisable when applying to an engineering program—at least one that requires or recommends Subject Test scores. The storytelling aspect of Subject Tests is why we recommend against taking a foreign language test in which you are a native speaker and against taking Math 1; other parts of your application better address your language fluency, and Math 2 sends a more convincing signal about your math skills—something particularly important for STEM applicants. There are exceptions to every rule, but these recommendations hold for most students. - “My ACT Composite and ACT Math of 28 are both 91st percentile, but my 700 on Math 2 is only the 48th percentile. Should I retake Math 2? Is it worth submitting?”
As with Subject Test to Subject Test comparisons, percentiles are poor indicators of cross-test performance. Almost 2 million students take the ACT each year, whereas only 145,000 talented math students take Math 2. Your ACT Math score can be better compared to your Math 2 score by using a concordance table to find the comparable SAT Math score. [A partial concordance table can be found in Appendix B below.] An ACT to old SAT concordance table shows that a 28 is comparable to a 640 SAT Math. This means that you likely scored higher on Math 2 than did most students with your ACT score. A decision on whether or not to submit a Subject Test score depends on a variety of factors, but it appears that Math 2 would strengthen your testing profile. - “Alma Mater University shows average old SAT scores of 651 CR, 660 M, and 645 W for its recently enrolled class. My SAT scores are good, but how can I know if my Subject Test scores are strong enough?”
Not all students who take Subject Tests end up submitting any or all scores to colleges. Since students are likely to submit their best Subject Test scores, the mean Subject Test scores for enrolled students are often slightly higher than the college’s mean SAT scores. It’s likely that Alma Mater’s mean Subject Test scores are in the 650–680 range. Although having Subject Test scores above or below that mark does not mean acceptance or rejection any more than it would with SAT or ACT scores, you can use average scores or mid-50th percentile scores as a rough way of assessing the strength of your own test scores. This becomes more important if Alma Mater views Subject Test scores as optional. If your scores are above average, they may be useful “plus factors.” If you struggled to get 600s on your Subject Tests, you may want to submit only your SAT or ACT scores. This decision also comes up frequently when students apply to colleges that allow the ACT to substitute for both the SAT and Subject Test. - “Our high school has an average Biology-M score of 690 and an average Math 2 score of 640. Is our Math Department doing something wrong?”
There are many reasons why Subject Test scores might differ within a school. For example, the Math Department may encourage all students to take the Math 2, whereas only AP Biology students take Biology-M. An initial step is to compare the pools via SAT scores (or concorded ACT scores). For Math 2, the input is simple: SAT Math scores. A range of 630–650 would be expected based on the Math 2 mean. If the school sees SAT Math scores well outside of that range, it may need to evaluate whether it is having students test at the appropriate time or whether it should add some review of important Math 2 concepts. It’s likely that the pool of Biology-M students has a mean SAT (CR and M) score between 670 and 700. Students taking AP Biology are usually well-prepared for the Biology Subject Test. In fact, given the scores presented, the school may want to consider having more students attempt the exam or take practice tests. These are just thumbnail sketches of how Subject Test scores can be analyzed; there are many factors that educators should consider.
The appendix post contains concordances for ACT and New PSAT and data for the scatterplots above.
