On January 19th, 2021, College Board announced that they will no longer administer the SAT Subject Tests in the U.S. and that the Essay would be retired. Read our blog post to understand what this means in the near term and what the College Board has in store for students down the road.
Our articles on Subject Tests and the SAT Essay will remain on our site for reference purposes as colleges and students transition to a revised testing landscape.
 When we discuss SAT Subject Tests with parents and students, there is a familiar set of questions. The first two are straightforward: Do I need Subject Tests? Will I benefit from Subject Tests? You can find answers in our list of colleges requiring or recommending Subject Tests and our post on what is a good Subject Test score. The trickiest question has always been: How can I choose and prepare for Subject Tests? Compass’ new interactive Subject Test score reports provide a powerful set of tools to answer that question.
>We have detailed reports for 9 of the most popular Subject Tests. In just an hour of testing time, you can see how you score and also obtain a set of key metrics to give you insight into your performance and help develop an efficient test prep plan—on your own or with a tutor. We’ve incorporated percentile ranks, contextualized your performance with that of other test-takers, highlighted the attractor answers that trip up many students, and provided a detailed breakdown of the content tested. All of this combined allows you to make informed decisions about how to allocate your prep time.
Students miss questions on the SAT Subject Tests because they have gaps in one or more of four areas: knowledge (they’ve never seen the material), memory (they have learned and forgotten the material), mastery (they struggle to feel confident with the material), and strategy (not knowing the specialized rules of the road around timing, guessing, and trap answers). When paired with a thoughtful review and self-assessment, our reports help students identify which kinds of gaps they’re experiencing.
Let’s take a look at a student, Sally, and what she learned about her performance on the Math Level 2 Subject Test.
Case Study: Sally and Math Level 2
Sally is applying to the College of Arts and Science at Cornell, which requires two Subject Tests. She took a practice test and used our score report to identify Math Level 2 as a strong test for her that could be made even stronger.
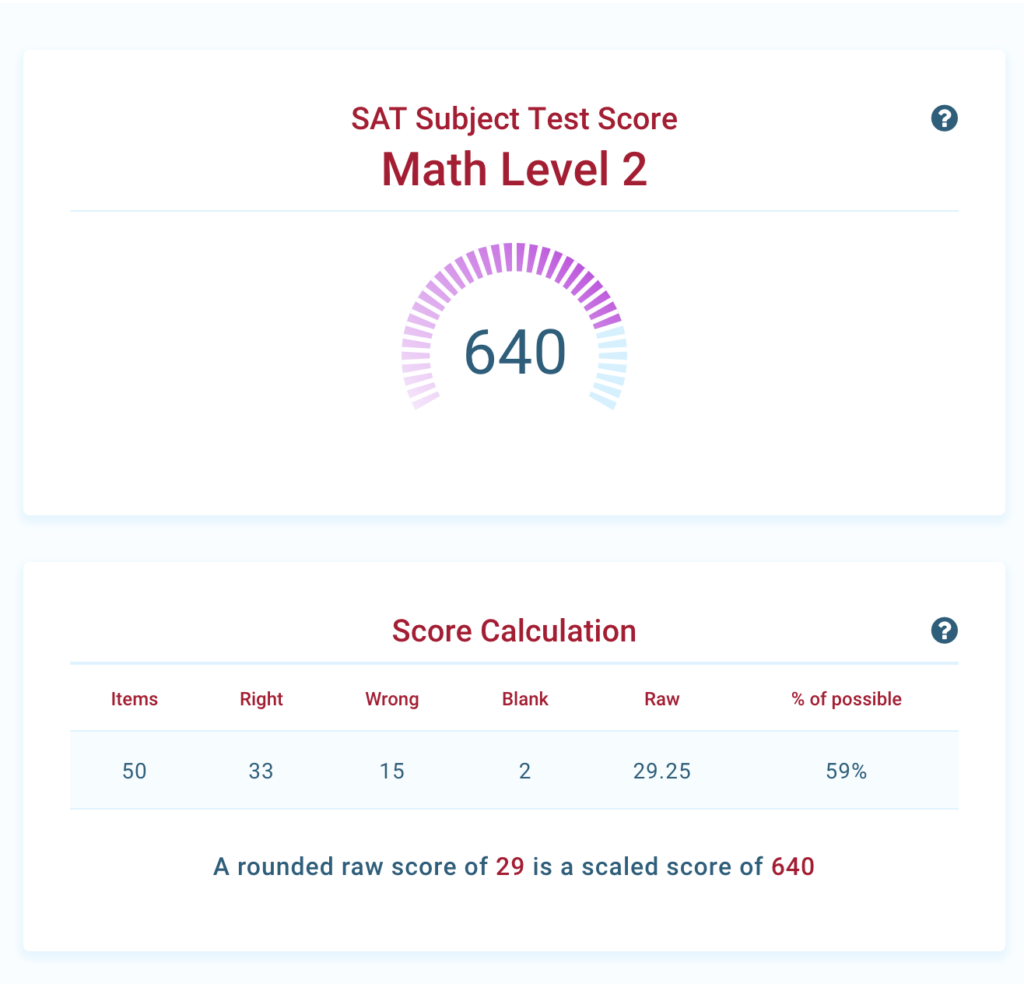
The first thing she noticed was how much her wrong answers were dragging down her score. Fifteen wrong answers dragged her raw 33 down to a rounded 29. Had she simply skipped those questions, her scaled score would have been 30–40 points higher.
The first thing Sally can take away from the score report is strategy: she needs to give herself permission to skip problems when she is struggling.
Sally was feeling pretty good about the 640; after all, she got a 700 on the SAT Math Test, and the Subject Test covers more advanced content. But then she noticed her percentile rank: 28th percentile. 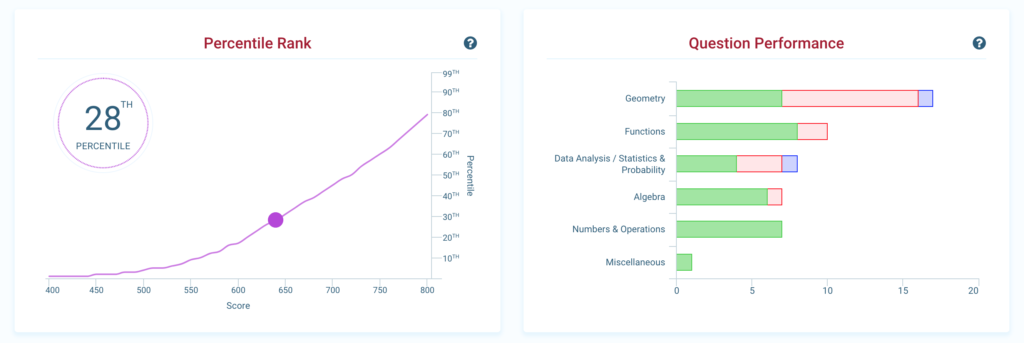 She wondered why the percentile was so low, until she noticed that the graph shows a perfect 800 as being only the 80th percentile rank. That’s because 20% of students who take this Subject Test get a perfect score. To have competitive scores, Sally realized that she’d need to do more than simply skip a few questions; she was going to have to brush up on her math skills.
Fortunately, the areas on which she needs to focus are clearly laid out in a question performance bar chart. A quick look at this chart made it clear that she would need to spend some time reviewing Geometry and Data Analysis. She remembered that there was some material on the test that she’d never seen before; she might need her tutor to help her get a little ahead of her math class.
Sally and her parents set up a series of Math Level 2 tutoring lessons.
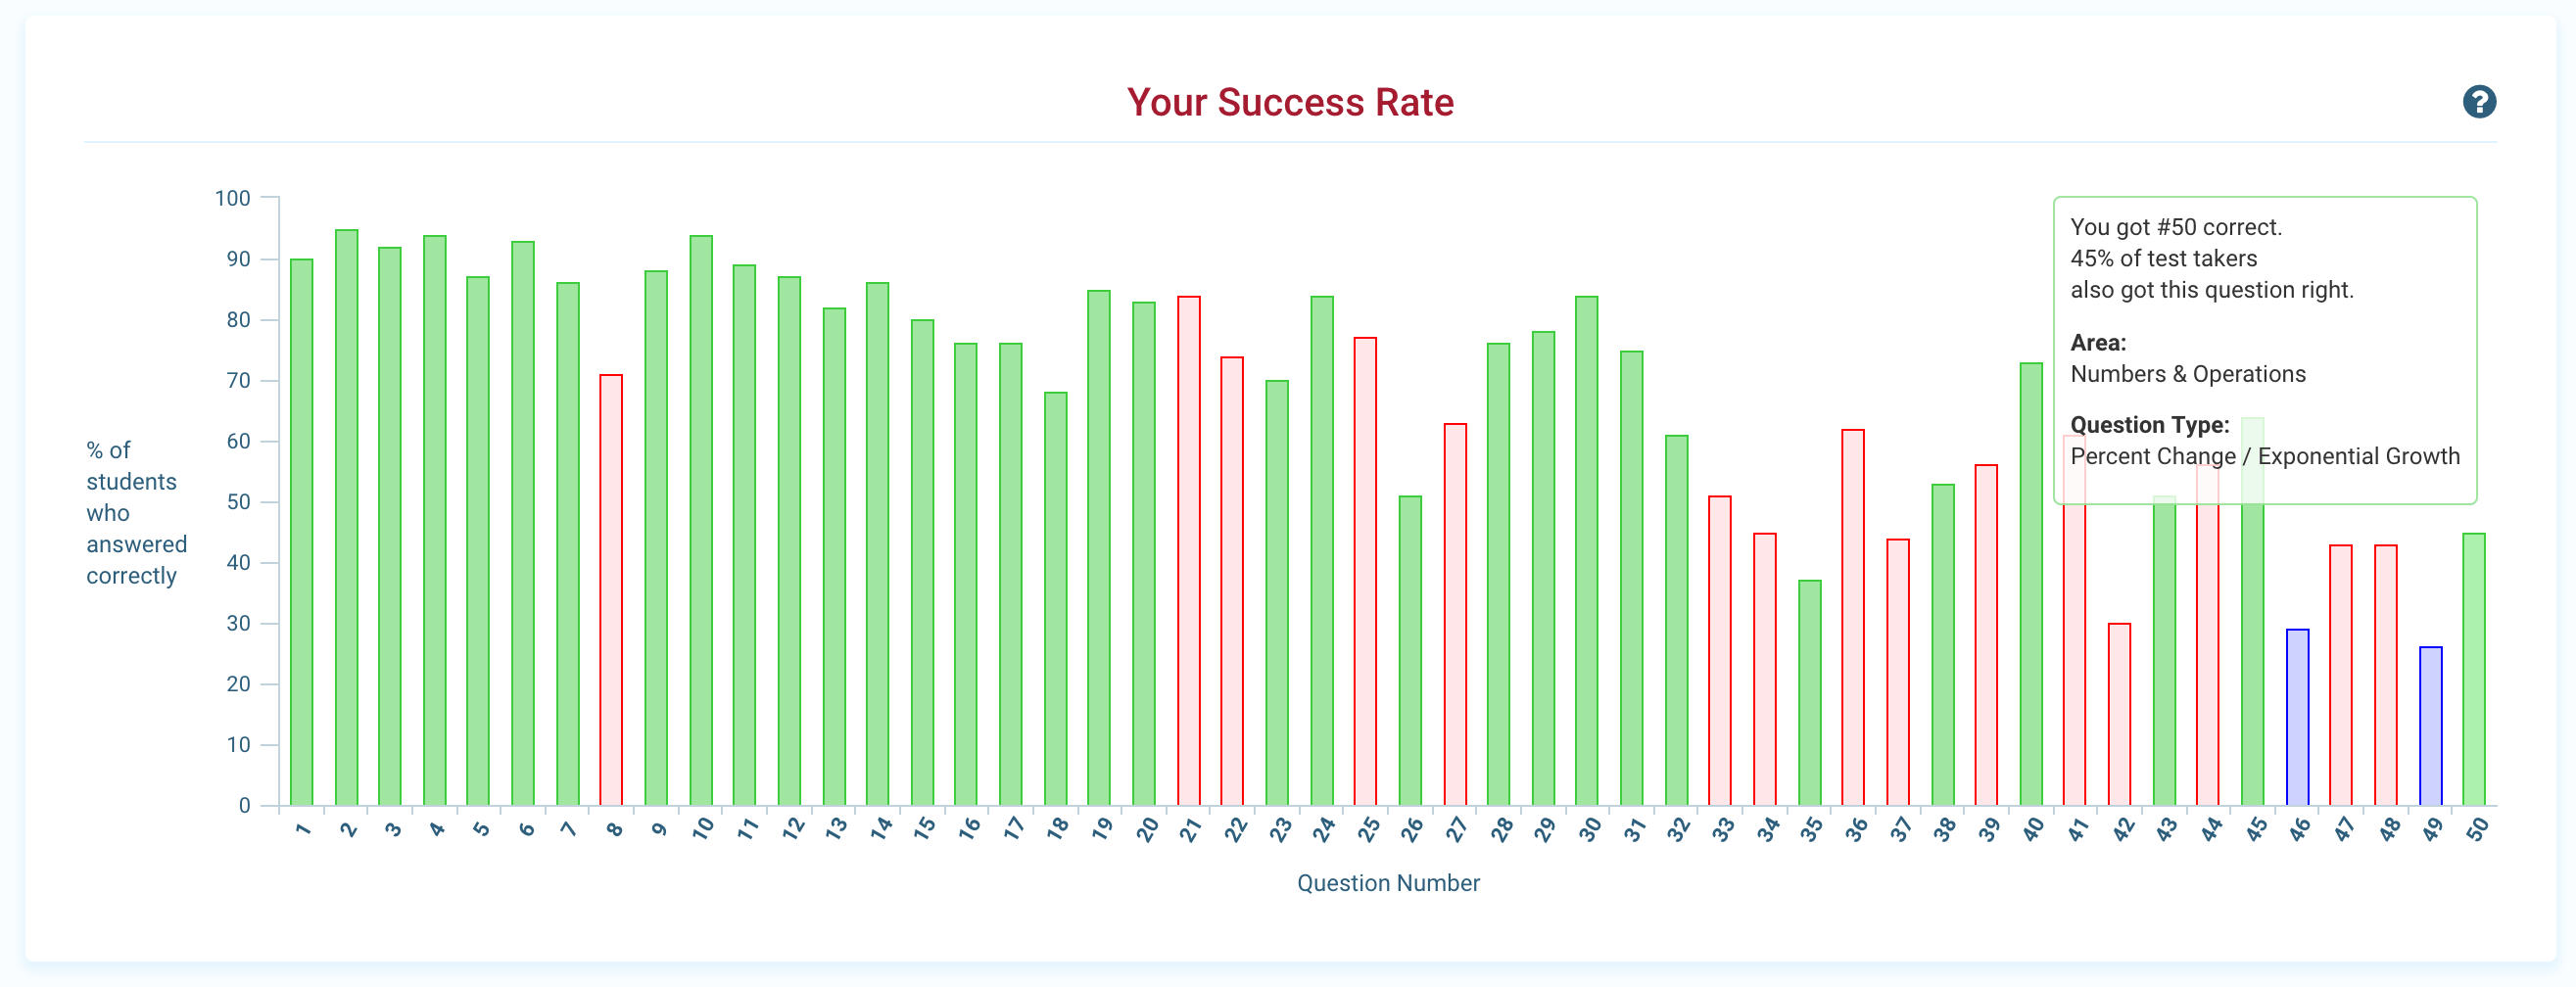
The first lesson found Sally and her tutor reviewing her performance on a question-by-question basis. Sally was interested in the Success Rate bar graph. This shows the student’s performance in the context of how other students have performed on each question. The higher the bar, the more students got the question correct. Sally’s tutor suggested that they might work to first make sure she’s getting right all of the questions that 60% or more of students got correct. She was heartened to see that she’d skipped a couple of the hardest questions. And looked forward to skipping a few more hard ones so she could spend that time getting easier ones correct.
Sally and her tutor then turned to the test booklet to determine, question by question, what kind of gaps she had experienced. Here, the answer list proved most useful because they could filter the questions to look only at the ones she got wrong and then sort by topic area. Trigonometry was clearly her biggest stumbling block, which was not surprising because it was the one topic area she hadn’t yet encountered in class.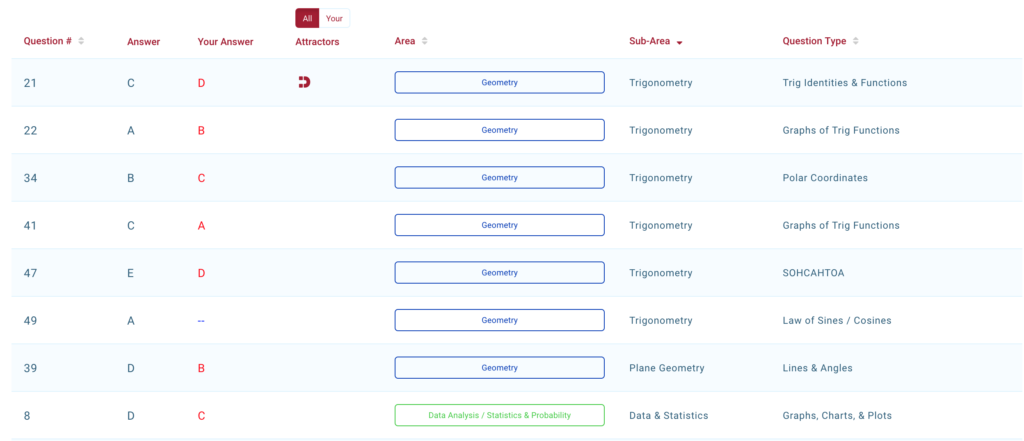
Sally and her tutor made a plan to fill this gap in knowledge and get a little ahead of her class so that she’d be familiar enough with trigonometry to do well on these questions come test day.
The other thing that popped out to them as they reviewed the report was that of the other questions she got wrong, most had a magnet icon in the Attractor column, meaning that Sally had fallen for the most popular wrong answer.
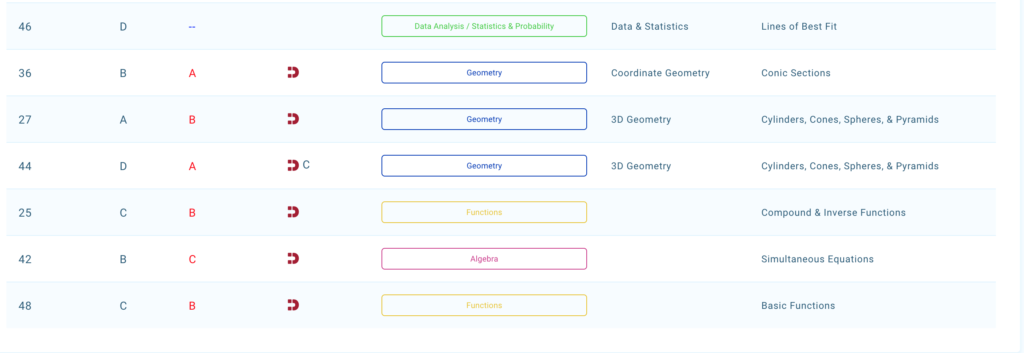
This suggested that there were gaps in both memory and strategy. Something about the way each question is asked lures students into a particular wrong answer.
Normally, Sally succeeds in avoiding these traps, which crop up on about one-third of all questions. But she has some gap in memory or mastery—and sometimes she is simply a bit careless—that is allowing her to fall for the attractor answers in the identified set of questions.
By the end of the test review, Sally had a clear picture of what she needed to do to prepare to take the exam and the confidence to score much higher.
Preview our U.S. History Interactive Score Report
Take a Practice Test with Compass
Our unique score reports are available to students who sign up to take a practice test with us. We offer on-site locations across the country and weekly online sessions. Our initial diagnostic tests are best paired with a complimentary consultation with one of our expert directors and one-on-one tutoring.
