
The redesigned ACT student score reports aim to contextualize students’ scores and offer details about students’ individual strengths and weaknesses. Unfortunately, these goals are impeded by the overwhelming volume of information included on score reports.
This post breaks down the exact contents of the student score report and explores how both students and parents can benefit from the information.
Which Scores Are Most Important?
Scores that will matter most to students are located in the upper left-hand corner: composite and individual test scores. The composite score is the average of the four tests: English, Math, Reading, and Science. Each test is scored on a scale of 1–36 (see our post on how the SAT and ACT are scaled for further explanation of scaling).
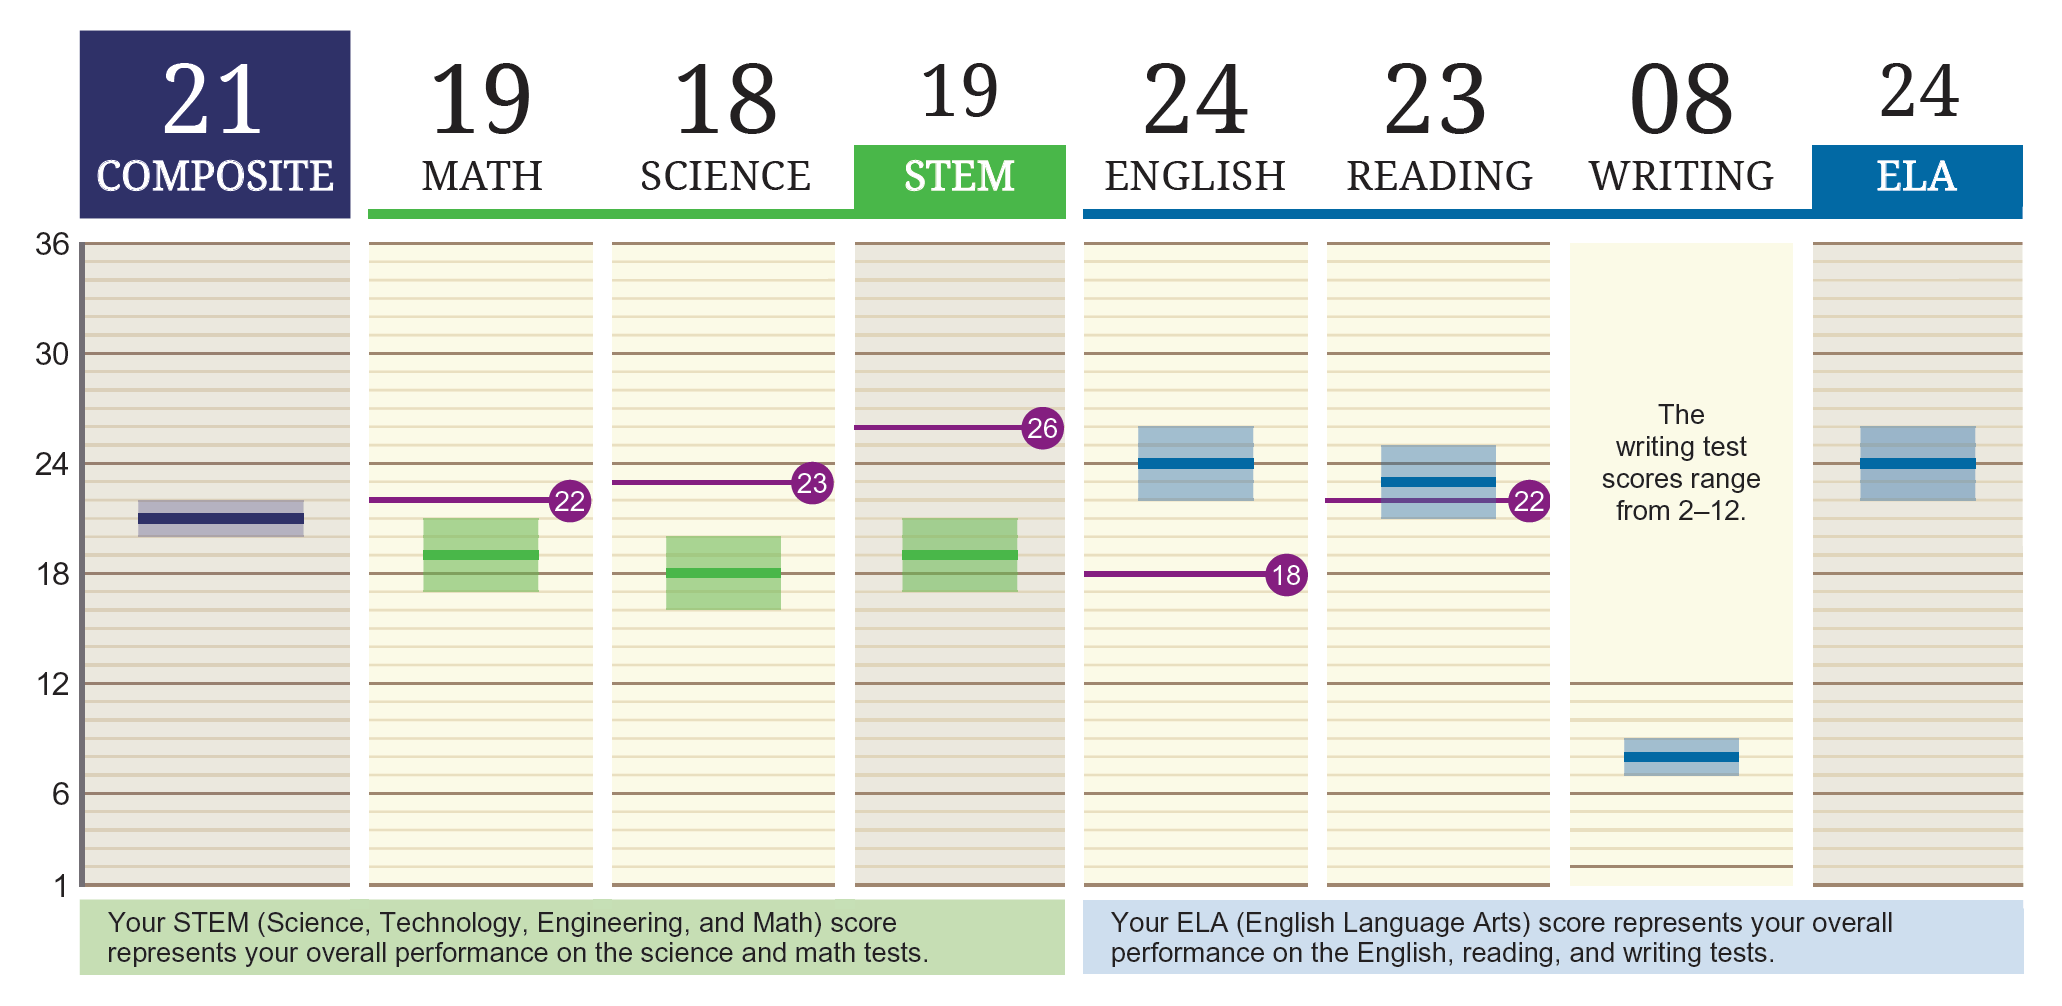
The wide bands surrounding each score represent the range of scores a student would be expected to achieve if he or she were to retake the test in quick succession. They illustrate the idea that no score is exact, but they reflect the central point in a range of possible scores that result from natural variations in test difficulty and testing environment. The range is known as the standard error of measurement (SEM). Note that individual tests have an SEM of +/- 2 points, while the composite score has an SEM of +/- 1 point.
What Are ELA and STEM Scores?
The order of tests is always English, Math, Reading, and Science, followed by the optional Writing Test. However, the score report groups Math and Science and then averages the two into the STEM (Science, Technology, Engineering, and Math) score. Likewise, English, Reading, and Writing are combined for the ELA (English Language Arts) score.
If a student does not take the optional Writing Test, ACT will not provide an ELA score.
The ELA score is complicated by ACT’s decision to return to a 2–12 scaled score for Writing in the 2016–2017 testing year from the 1–36 scaled score used in the 2015–2016 testing year. In order to generate the average ELA score, the three ELA tests must be scored on the same 1–36 scale. On the score report, Writing will not be shown with a 1-36 scale, but the Writing score will still be used to determine the average ELA score.
ACT has stated that a student can estimate the 1–36 score by using the following equation:
(English + Reading + Writing) / 3 = ELA. In the example above, we have (24 + 23 + Writing) / 3 = 24. The Writing score range is, therefore, 24–26.
Need Help Interpreting Your ACT Score Report?
Fortunately, ACT’s STEM and ELA scores are not typically used for college admission; they exist for school and district administrators. For more information on the schools that require the writing assignment, please see our blog post on essay requirements. In other words, students don’t need to worry about the STEM and ELA scores.
What Is the ‘College Readiness Benchmark,’ and How Do My Scores Compare to Other Students’ Scores?
The purple line in each individual test column reflects the “college readiness benchmark,” the score point at which a student has a 50% chance of earning a B or higher in a corresponding first-year college class.
Students may be tempted to evaluate performance by comparing scores across subjects. However, if the 2015-2016 ACT essay debacle taught us anything, scaled scores are meant for comparing performance across sittings and not subjects. ACT deems it more accurate to compare performance in each subject against the pools of test takers. And so the new score reports helpfully supply rank right below the student’s scores.
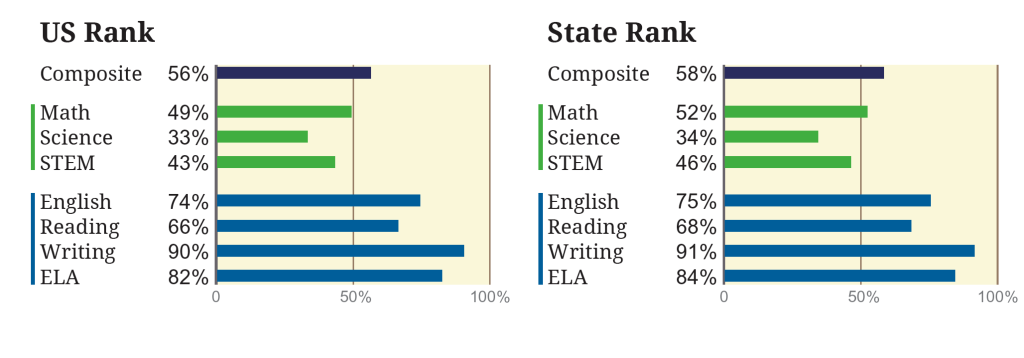 ACT provides two sets of percentile ranks: sets are determined by data from the entire previous year’s performance, not from sample groups (unlike the current SAT). U.S. Rank show the student’s performance relative to that of the entire U.S. test taker population; State Rank shows the student’s performance relative to that of the population of the student’s state. The terms “Percentile” (SAT) and “Rank” (ACT) mean the same thing: it’s the percentage of students scoring at or below the student’s score.
Percentile ranks are useful for comparing a student’s performance to a population taking the same test. They should not be used for comparing performance between tests (like Math vs. English). To compare SAT to ACT scores, colleges and advisors use concordance tables.
How Do I Interpret the ‘Detailed Results’ Section?
Beneath scores and ranks lie the detailed results. ACT has been engaged in a project of bringing the exam into alignment with state education standards like the Common Core. As a result, they have renamed some of the topics tested, but the content remains largely unchanged.
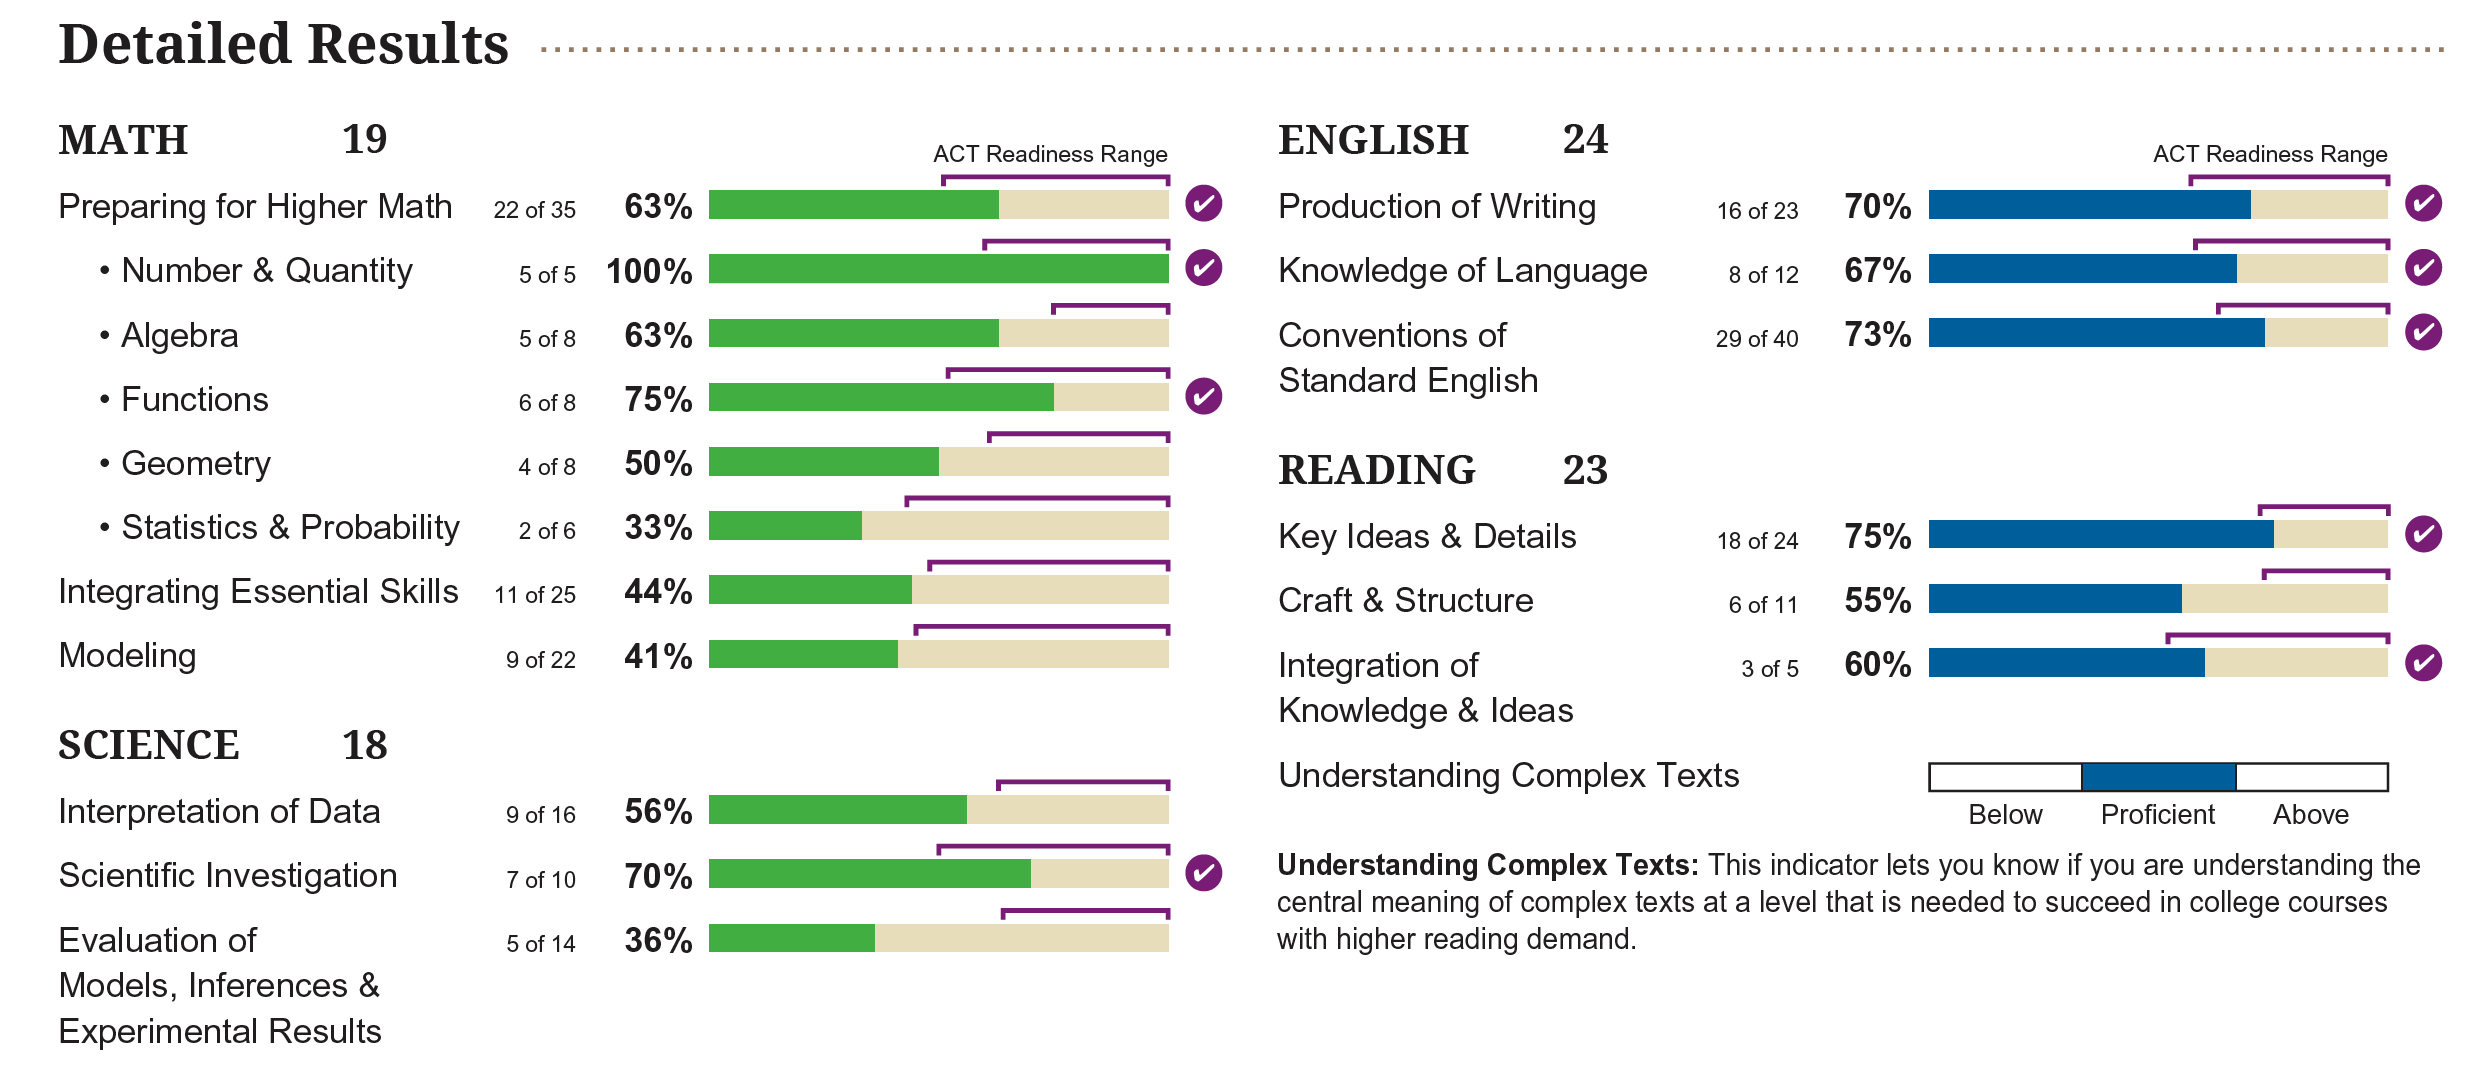
Under the Math heading, ACT distributes questions in three categories: Preparing for Higher Math, Integrating Essential skills, and Modeling. What were once the clear subcategories of Pre-Algebra, Algebra and Coordinate Geometry, and Plane Geometry with Trigonometry is now a blend of very specific topics like Functions and vague descriptions like “modeling.” The questions are the same; they are simply labeled differently.
Our advice is to not get bogged down in these details. Colleges don’t look at these results, and – unless a student has purchased ACT’s Test Information Service (TIR) for the December, April, or June tests – she won’t know why she missed these questions.
What Are the ‘College and Career Planning’ Portions of the Report?
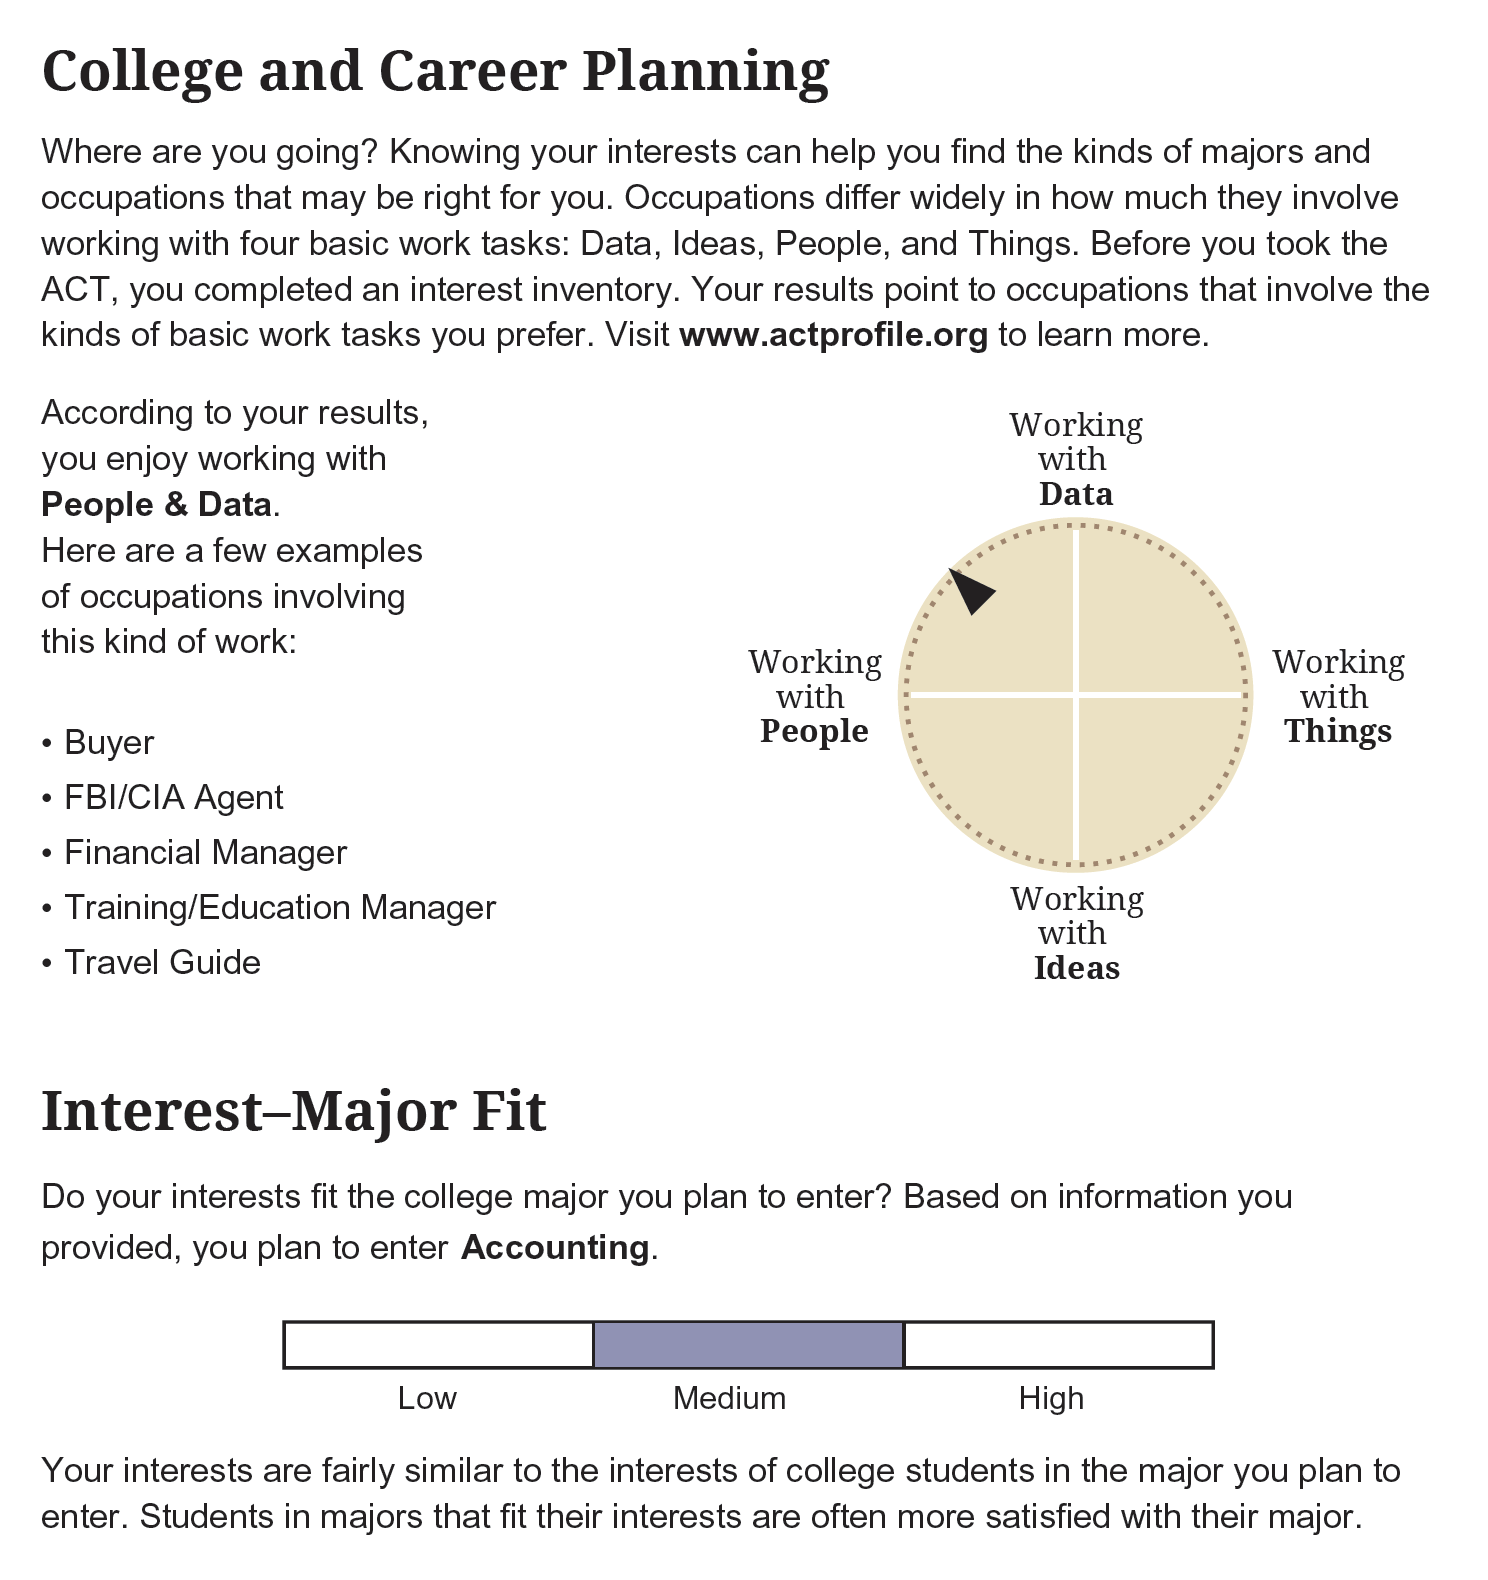
One thing to note about College and Career Planning is that this information is based on the questions a student may have answered when registering for the exam. The Interest-Major Fit is NOT based on test performance, but on what the student says she’d like to do. Along with score, that personal information is reported to colleges, so students may want to be judicious with what they share at the registration stage. 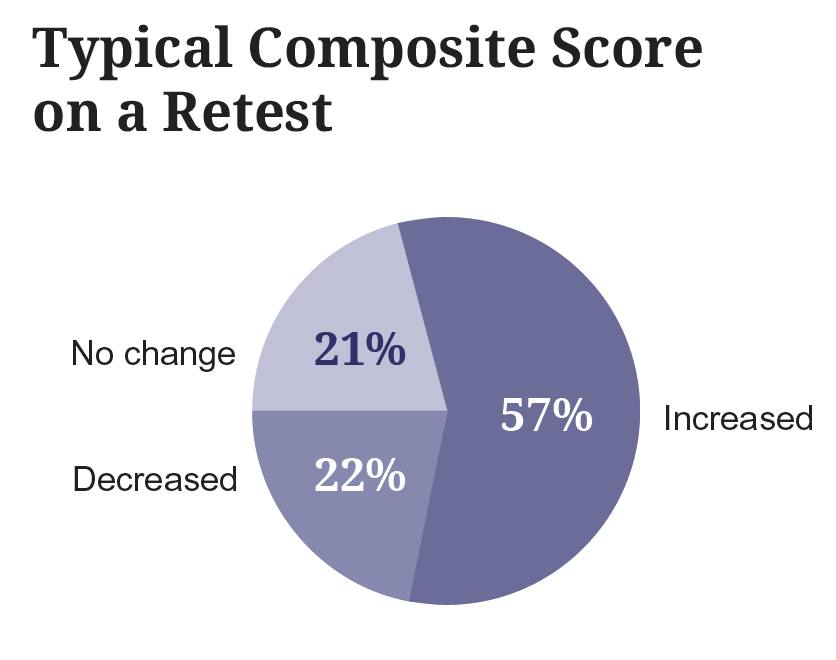
Should I Retest?
ACT helpfully supplies a graph for a “Typical Composite Score on a Retest” but students should keep in mind that this graph is not related to the score they received. In addition, many schools “superscore,” which means they’ll cherry pick a student’s highest test scores across test dates and create a new composite score based on those scores. For more information about which schools superscore, please see our post on superscore and score choice policies.
Though the new score reports appear to give students information about gaps in their knowledge, the reports don’t show how much performance was affected by the speeded nature of the test. Perhaps a student would have received a higher score if she had made it to a few more science questions. Sometimes score increases come not from studying the content of the test (though doing so certainly can help) but by being strategic about where a student devotes time and effort to maximize score within the strict time constraints.

Hi Ash
Thank you for the nice article on how to interpret the score report. Per the article, colleges don’t care about the ELA or Stem scores. My son got a composite of 35 but his stem score is 33. He is looking at applying for highly competitive schools including some direct med program schools. Curious to know if those schools will look at composite score and compare it with other students while making a decision on admitting or will look at the individual scores of ACT on top of other factors like GPA, ECA etc etc. Thank you in advance for your help.
Sam,
Most colleges will start with the Composite score but will also look at test scores. Since the STEM is just an average of Math and Science, it doesn’t give colleges any new information. But, yes, they do look at Math and Science scores.