
Compass projects lower qualifying scores for the Class of 2027
The junior year PSAT is also the NMSQT — the National Merit Scholarship Qualifying Test. Each year, National Merit recognizes the top 57,000 test takers. In order to be included in that group, students need to be among the top 4% of the 1.4 million students who take the PSAT. Of that elite group, approximately 17,000 are recognized as Semifinalists for having the highest scores within their states. Semifinalists have the opportunity to continue in the program to become Finalists and, potentially, scholarship recipients. The remaining 40,000 students are recognized as Commended Students. More information can be found in our National Merit Explained post.
For the Class of 2027, the exact scores needed to qualify (“cutoffs”) will not be released until September 2026 (the Commended cutoff is likely to leak in April). In order to give students context for their test results, Compass has analyzed the scores from the October 2025 to produce estimates for the national Commended cutoff and the individual state cutoffs. We predict that the majority of state cutoffs will decline this year.
National Merit uses the Selection Index (SI), found on the PSAT score report, to rank students. The Selection Index can be calculated by doubling the Reading & Writing score (RW), adding the Math score (M), and dividing that sum by 10. For example, a student with a 720 RW and 700 M score has a Selection Index of 214 — (720 x 2 + 700)/10. The weighting of the index means that not all students with a 1420 Total Score have the same SI. A student with a 700 RW and 720 M has a Selection Index of 212. The highest SI a student can receive is 228 (760 RW and 760 M). Last year, the Commended cutoff was 210, and Semifinalist cutoffs ranged from 210 to 225 depending on the competitiveness of the state.
Why do we foresee lower cutoff scores?
College Board does not release any information about the distribution of Selection Indexes, but it does produce summaries of broad score ranges. The number of students in the 1400 – 1520 Total Score range has proved to be an excellent indicator of the Commended cutoff. The Class of 2027 saw 16% fewer top scores than did last year’s class. The 52,400 students at 1400 and above is closer to what we saw two years ago with the Class of 2025 and, going back further, similar to the results for the Classes of 2017 and 2021.
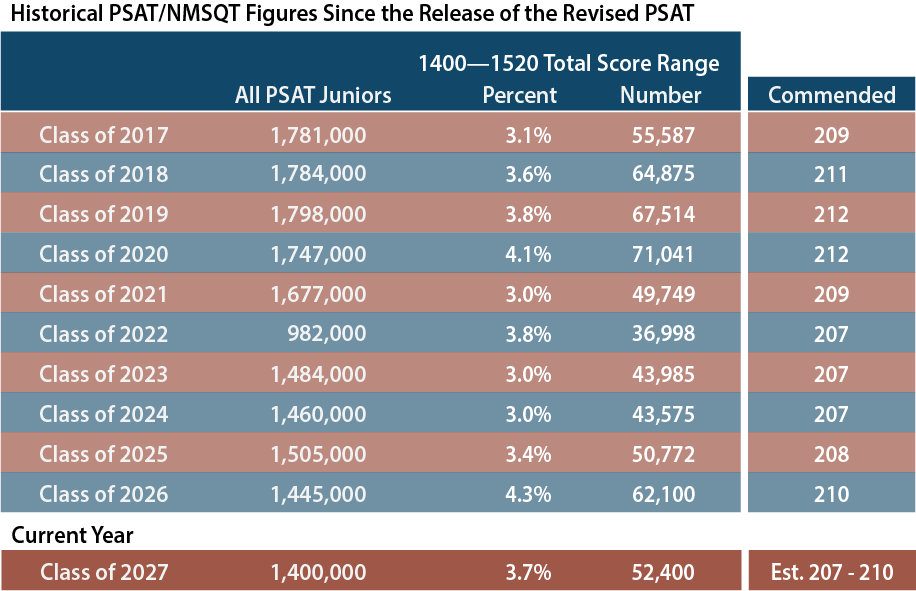
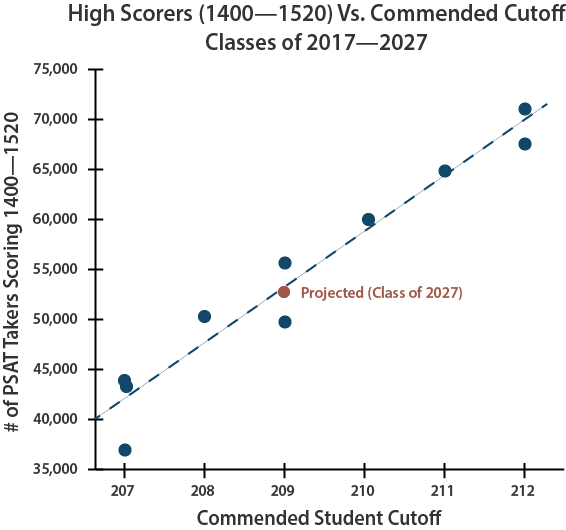
Most of the students who will qualify for National Merit recognition fall in the 1400 – 1520 band (or just outside it). With approximately 10,000 fewer students in the top band of scores this year, we expect the Commended level to drop to 208 or 209. The chart below shows the historical relationship between high scores and the Commended cutoff.
Explaining why last year’s cutoffs reached record levels
After examining this year’s numbers, we also have a better understanding of why Semifinalist cutoffs jumped to such extreme levels last year, and why it should not happen again. The 2024 PSAT saw an unprecedented 18% jump in the number of high Reading & Writing scores (700-760). The weighting of RW in the Selection Index magnified the impact of that change. The table below shows scores for the last three years and how results have fluctuated.

On the 2025 PSAT, the number of high RW scores dropped by 27%. In fact, the RW count for this year is even lower than it was two years ago. The decline in RW scores could even produce Selection Indexes lower than those in the Class of 2025 — at least in some states. The Commended cutoff may provide additional insight in the spring.
The ratio of 700+ M scores to 700+ RW scores reveals just how bizarre last year’s spike was. Traditionally, Math scores have higher distributions at the extremes. There are more very high Math scores on the PSAT and SAT, and there are more very low Math scores.
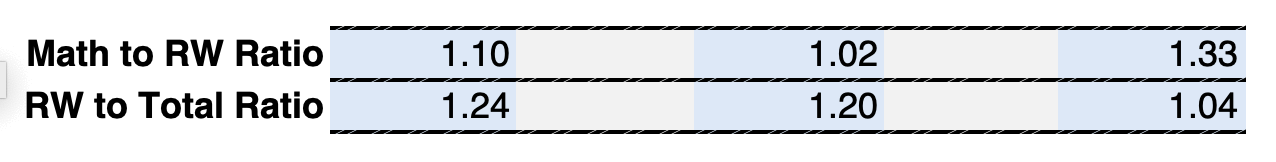
On the October 2024 PSAT, though, almost as many students scored 700-760 on RW as did on Math. The ratio of high Math scores to high RW scores was 1.02. This helps explain why some cutoffs went as high as 224 and 225 for the first time ever. Students achieved 750 and 760 RW scores in record numbers. In most years, there would be more students scoring 730 RW and 760 M (222 SI), for example, than scoring 760 RW and 730 M (225 SI). That was not true in the the Class of 2025, where there was a more equal distribution. It appears that scores for the Class of 2027 have returned to the traditional Math-heavy distribution. The ratio of high Math scores to high RW scores was 1.33 on the 2025 PSAT/NMSQT. For this reason, we don’t believe we will see a repeat of the 224 and 225 cutoffs seen last year.
Was last year a fluke, shift, or a trend?
The results from the Class of 2027 have answered one of the nagging questions from last year: Were the high cutoffs a fluke, shift, or trend? The answer appears to be fluke. More accurately, results could be labeled an error in test construction and scaling. There is no evidence that the Class of 2026 possessed special test-taking skills. As sophomores, that class performed in line with expectations on the 2023 PSAT. There is no evidence that the Class of 2027 has diminished skills. As sophomores, the class saw the same inflated scores as did the juniors on the 2024 PSAT. The best explanation is that College Board lost control of the scale. College Board dramatically shortened the PSAT when it switched from paper to digital. On the paper test, the Reading and Writing sections had 91 questions, and students were given 95 minutes. The RW on the digital PSAT is truncated to 54 questions over 64 minutes. And only 50 of the questions count toward a student’s score! A shorter exam means a less reliable exam. We saw the occasional wild ride on the paper PSAT, but the rides may get wilder and more frequent on the digital PSAT.
We anticipate the majority of state Semifinalist cutoffs to decline for the Class of 2027. Knowing this overall trend, however, doesn’t tell us which states will be in that majority or how much lower scores will go. The table below provides a Most Likely cutoff score, but the more useful information is the Estimated Range. Almost all cutoffs should fall within that range.
State | Class of 2027 (Most Likely) | Class of 2027 (Est. Range) | Class of 2026 (Actual) | Class of 2025 (Actual) | Class of 2024 (Actual) | Avg NMSFs |
|---|---|---|---|---|---|---|
| Alabama | 213 | 210 - 216 | 214 | 212 | 210 | 250 |
| Alaska | 214 | 210 - 216 | 215 | 214 | 209 | 35 |
| Arizona | 218 | 215 - 220 | 218 | 217 | 216 | 398 |
| Arkansas | 213 | 210 - 216 | 215 | 213 | 210 | 143 |
| California | 223 | 220 - 224 | 224 | 221 | 221 | 2,115 |
| Colorado | 218 | 216 - 221 | 219 | 218 | 216 | 286 |
| Connecticut | 222 | 220 - 223 | 223 | 221 | 221 | 175 |
| Delaware | 219 | 218 - 221 | 220 | 219 | 219 | 44 |
| Florida | 217 | 216 - 220 | 219 | 217 | 216 | 999 |
| Georgia | 219 | 217 - 221 | 220 | 218 | 217 | 602 |
| Hawaii | 218 | 215 - 220 | 219 | 217 | 217 | 62 |
| Idaho | 214 | 211 - 217 | 215 | 213 | 211 | 96 |
| Illinois | 220 | 218 - 222 | 222 | 220 | 219 | 704 |
| Indiana | 217 | 214 - 219 | 218 | 217 | 216 | 313 |
| Iowa | 213 | 211 - 216 | 214 | 212 | 210 | 145 |
| Kansas | 216 | 213 - 219 | 216 | 215 | 214 | 144 |
| Kentucky | 214 | 211 - 217 | 214 | 213 | 211 | 201 |
| Louisiana | 215 | 212 - 218 | 216 | 214 | 214 | 222 |
| Maine | 215 | 212 - 217 | 217 | 214 | 213 | 55 |
| Maryland | 223 | 221 - 225 | 224 | 222 | 221 | 308 |
| Massachusetts | 223 | 221 - 225 | 225 | 223 | 222 | 318 |
| Michigan | 219 | 216 - 220 | 220 | 218 | 217 | 485 |
| Minnesota | 218 | 216 - 220 | 219 | 217 | 216 | 279 |
| Mississippi | 213 | 210 - 215 | 213 | 212 | 209 | 155 |
| Missouri | 216 | 213 - 218 | 217 | 215 | 214 | 289 |
| Montana | 211 | 208 - 214 | 213 | 209 | 209 | 47 |
| Nebraska | 213 | 210 - 216 | 214 | 211 | 210 | 105 |
| Nevada | 214 | 211 - 217 | 214 | 214 | 211 | 168 |
| New Hampshire | 217 | 214 - 219 | 219 | 217 | 215 | 60 |
| New Jersey | 223 | 222 - 225 | 225 | 223 | 223 | 451 |
| New Mexico | 211 | 208 - 214 | 210 | 211 | 207 | 104 |
| New York | 221 | 219 - 223 | 223 | 220 | 220 | 1,012 |
| North Carolina | 219 | 216 - 221 | 220 | 218 | 217 | 510 |
| North Dakota | 210 | 207 - 212 | 210 | 210 | 207 | 30 |
| Ohio | 218 | 215 - 220 | 219 | 217 | 216 | 538 |
| Oklahoma | 212 | 208 - 214 | 212 | 211 | 208 | 204 |
| Oregon | 218 | 215 - 220 | 219 | 216 | 216 | 188 |
| Pennsylvania | 220 | 217 - 222 | 221 | 219 | 219 | 596 |
| Rhode Island | 217 | 214 - 220 | 219 | 217 | 215 | 47 |
| South Carolina | 214 | 210 - 217 | 215 | 214 | 209 | 236 |
| South Dakota | 210 | 207 - 213 | 211 | 208 | 209 | 42 |
| Tennessee | 218 | 215 - 219 | 219 | 217 | 217 | 319 |
| Texas | 221 | 218 - 222 | 222 | 219 | 219 | 1,623 |
| Utah | 212 | 210 - 216 | 213 | 211 | 209 | 196 |
| Vermont | 215 | 211 - 217 | 216 | 215 | 212 | 28 |
| Virginia | 222 | 220 - 224 | 224 | 222 | 219 | 437 |
| Washington | 222 | 220 - 224 | 224 | 222 | 220 | 348 |
| West Virginia | 209 | 207 - 212 | 210 | 209 | 207 | 64 |
| Wisconsin | 214 | 213 - 217 | 215 | 214 | 213 | 292 |
| Wyoming | 209 | 207 - 212 | 210 | 209 | 207 | 24 |
| District of Columbia | 223 | 222 - 225 | 225 | 223 | 223 | 36 |
| Territories | 209 | 207 - 211 | 210 | 208 | 207 | 39 |
| Outside US | 223 | 222 - 225 | 225 | 223 | 223 | 86 |
| Commended | 209 | 207 - 210 | 210 | 208 | 207 |
How cutoffs are determined
Qualifying scores (“cutoffs”) are not based on the total score for the PSAT (360-1520) but on the Selection Index, which is calculated by doubling the RW score, adding the Math score, and then dividing the sum by 10. The maximum Selection Index is 228. Students can find a historical set of cutoff data here or see how Semifinalist and Commended counts have changed state by state.
We estimate that the Semifinalist cutoffs will range from 209 to 223. Semifinalists are allocated by state, and cutoffs are calculated by state. If Florida is allocated 1,000 Semifinalists based on its population of high school graduates, then NMSC works down from a perfect 228 Selection Index until it gets as close as possible to that target. Last year, 1,008 students scored at or above the cutoff of 219. A cutoff of 220 would have produced too few Semifinalists. A cutoff of 218 would have gone over the allocation. Because score levels can get crowded, it is easy for cutoffs to move up or down a point even when there is minimal change in testing behavior or performance.
Why does each state have its own Semifinalist cutoff if the program is NATIONAL Merit?
This is always a hot button question. NMSC allocates the approximately 17,000 Semifinalists among states based on the number of high school graduates. That way, students across the nation are represented. It also means that there are very different qualifying standards from state to state. A Massachusetts student with a 220 might miss out on being a Semifinalist. If she lived 10 miles away in New Hampshire, she would qualify.
No Semifinalist cutoff can be lower than the national Commended level. Cutoffs for the District of Columbia and for U.S. students studying abroad are set at the highest state cutoff (typically New Jersey). The cutoff for students in U.S. territories and possessions falls at the Commended level each year. Boarding schools are grouped by region. The cutoff for a given region is the highest state cutoff within the region.
Change is always the theme
Over the last two decades, at least half of the state cutoffs have changed each year. In some years, as many as 49 states saw ups or downs, usually because of questionable test forms. In addition to last year’s exam, the PSATs from 2011 (Class of 2013), 2016 (Class of 2018), and 2019 stand out as problematic. The anomalous 2019 results could be traced back to a particularly mis-scaled form, which I wrote about at the time. The Class of 2014 also saw significant changes, but those were more of a bounce-back from the previous year. The question for the Class of 2027 is how much of a bounce-back will be seen this year.

Cutoffs are particularly bumpy in states with smaller pools of test takers and National Merit Semifinalists. Over the last dozen years, cutoffs in the 12 largest states have remain unchanged 36% of the time, while the cutoffs in the smallest states have remain unchanged only 1 time out of every 5. No large state’s cutoff has jumped by more than 3 points in a year, whereas 6-point changes have occurred in the pool of smaller states.

When are National Merit Semifinalists announced?
The lists of Semifinalists will not be distributed to high schools until the end of August 2026. With the exception of homeschoolers, students do not receive direct notification. NMSC asks that schools not share the results publicly until the end of the press embargo in mid-September, but schools are allowed to notify students privately before that date. NMSC does not send Commended Student letters to high schools until mid-September. Compass will keep students updated on developments as the dates approach.
Do state and national percentiles indicate whether a student will be a National Merit Semifinalist?
No! Approximately 1% of test takers qualify as Semifinalists each year, so it is tempting to view a 99th percentile score as indicating a high enough score — especially now that College Board provides students with percentiles by state. There are any number of flaws that rule out using percentiles as a quick way of determining National Merit status.
- Percentiles are based on section scores or total score, not Selection Index
- Percentiles are rounded. There is a large difference, from a National Merit perspective, between the top 0.51% and the top 1.49%
- Percentiles reveal the percentage of students at or below a certain score, but the “at” part is important when NMSC is determining cutoffs.
- The number of Semifinalists is based on the number of high school graduates in a state, not the number of PSAT takers. Percentiles are based on PSAT takers. States have widely varying participation rates.
- Most definitive of all: Percentiles do not reflect the current year’s scores! They are based on the prior 3 years’ performance. They are set even before the test is given. And if you are going to use prior history, why not use the record of prior National Merit cutoffs rather than the highly suspect percentiles?
Entry requirements for National Merit versus qualifying for National Merit.
Your PSAT/NMSQT score report tells you whether you meet the eligibility requirements for the NMSP. In general, juniors taking the October PSAT are eligible. If you have an asterisk next to your Selection Index, it means that your answers to the entrance questions have made you ineligible. Your answers are conveniently noted on your score report. If you think there is an error, you will also find instructions on how to contact NMSC. Meeting the eligibility requirements simply means that your score will be considered. Approximately 1.4 million students enter the competition each year. Only about 55,000 students will be named as Commended Students, Semifinalists, Finalists, or Scholars. See National Merit Explained for more information.

Connecticut is out. My child scored 223. The individual students were asked to keep their selection confidential until official reports to the media are made on September 15th listing who made it. While the cutoff is unclear, my child’s school had 4 semi-finalists and this school usually only has 1 student who reaches that benchmark. It may be that this class is a particularly strong one, but the cutoff may be simply lower than usual. Notably, every student in CT had an in-school SAT day, so there may be a number of students who qualified that way. Given the administration of the in-school SAT statewide, the number of CT SAT test-takers is likely very close to previous years.
Elizabeth,
Congratulations to your student! Yes, I suspect that CT’s cutoff will come in just a bit lower.
224 index, Texas. Public school.
Waiting for official confirmation before clicking submit on applications. Don’t want to jump the gun and make it appear I lied on the app calling myself a semifinalist.
You’re certainly safe, but it’s probably a good idea to see it in black-and-white. Congratulations.
My son has a 223 SI in Texas. Would he be safe as well? Is there any word on SI in TX?
Yes, 223 is very safe in TX. I’ve heard reports of 219 on other sites.
I read on college confidential that KY has a max cutoff of 213. Is this true or confirmed?
Molly,
That would be based on a student report, which I’ve found reliable.
Just got my letter from my principal, max cutoff in Alabama is 214. I had a 215, but the lowest scorer that got NMSF at my school had a 214 SI.
Congratulations, Mason! I’ll update the post.
Is 214 confirmed? Unfortunately, my daughter has a 213 in Alabama. Thank you for the information.
Right now all I know is that a student with 214 qualified. We don’t yet know if the actual cutoff is lower.
Hello Art,
Do you know the cut off for Florida? Thank you
Patricia,
Florida came in at 217 this year.
Waiting to hear in Colorado. son got 222. Any word yet?
No word on CO, Vicky, but I certainly like the chances of a 222.
Also waiting on NY. My son had a 219 SSI, so he is on the bubble.
My child received her NMSF letter in Ohio with a score of 220. A friend of hers at the same school got a score of 215 or 216 and received a NMSF letter as well . Sorry that I can’t remember the exact number. I just know they were 4 or 5 points less on their selection index score than my daughter when they shared that info previously.
Congratulations to your student, Kay. I’ll mark that down as a <=216 with an asterisk. Thank you.
My daughters friend did indeed get semifinalist with an index score of 215 in Ohio. Confirmed it w/ her parent tonight for you.
Great! Thanks, Kay.
Hello! If it is possible could you try to find out what her friends score was. I have a 215 SI and am so nervous!
Thank you:)
Riya,
Kay confirmed the 215 with the parent as of this evening (9/1).
Any news on South Carolina?
Not yet, Sofia. Please let us know if you get word!
Hello Art, do you think a selection index of 219 will make the cutoff in Texas? I have seen multiple reports of 219 making it on other forums, so just wanted to ask you!
I have no reason to doubt those reports, but I don’t have any additional information.
Hey Art, do you think that 219 will make the cutoff in Texas? Thank you.
Mike,
I’ve seen the reports of 219 on other sites, but I don’t have any additional confirmation.
Made Semi-Finalist in DE with an index of 221.
Congratulations, Violet! Thank you for sharing the information.
My son received his letter today and he is at 223. This is for Ohio.
Congratulations to your son, Melissa. I’m glad to hear that schools are getting the word out (or even better if he is home schooled!).
Anything from Virginia yet? Son got a 221.
Not yet, VAMom.
The letter students are receiving today are coming from the school district and/or principals of the high schools, correct? Meaning some kids in PA might have gotten letters today and some might not have? I think my HS SR is safely about the PA cut line, but anxiously waiting for confirmation.
Yes, a packet of letters is mailed to each high school (or home school). It’s up to the school to decide how and when to get the letters to students. Practices vary widely.
Though I personally haven’t seen the letter, my college counselor informed me today to expect an email coming with information about how to proceed as a NM Semifinalist (as the school received the letters, and I guess they want to write some fancy stuff up before giving them to us). I got a 221 index score in NC, so I’m not sure about how useful this information is to you (I’d expect a 218 at best in NC), but I guess at least it’s some starting point.
Congratulations, Jonathan. Information is always helpful for those still waiting for confirmation from their schools.
HS Counselor in CO here–two of our students with a 217 qualified. A 215 did not qualify. No student at our school had an SI of 216.
Thank you, Linda. I’ll update the post to reflect 216 or 217 as the CO cutoff.
I have a semi finalist in Arkansas with a 212
Congratulations to your NMSF, Holly!. Updating the post now.
Principal confirmed NMSF status today! SI of 224 in MD! Cutoff is likely lower, but at least we know it isn’t above 224, fwiw 🙂
That was a pretty safe bet, but I’m glad your wait is over. Congratulations! Thank you.
Hello. What if a student took the PSAT at a school other than their own due to covid. She has an index that should meet California criteria but hasn’t heard anything yet. Is it possible it got sent to the school she took it at instead of her own? Thanks
TTT,
The school that a student attends would receive the information. It is not at all unusual for students to have not received word yet. Some schools wait until mid-September! I’d give it another week and then make a polite inquiry to the college counselor.
212 max confirmed KY score. My son received notice from his school.
Thanks, Vernon. Best of luck to your son on his Finalist application!
Hello, Mr. Sawyer –
Any news on the cutoff for Iowa?
Deb,
I don’t have any direct reports.
Hi Art,
Thank you so much for these updates! I see your list includes Missouri <=215. I didn't see any comments from Missouri, so I assume you learned this from a different credible source? My D22 has a 218 and I'm on pins & needles. Thanks again.
JilliO,
It came from an earlier comment by a parent reporting on a Reddit post, so I don’t have independent confirmation. Can’t imagine that MO is setting new highs this year, so 218 seems solid. I know that probably doesn’t remove the pins or the needles. Good luck!
Hi, Art,
My student in Nebraska got his letter today. He had a 216 and thinks the cut off was 211.
Congratulations to your student! I’ve updated the post with his information.
Hi Art,
Is there only one report to your knowledge that the CA cutoff is not 220? I ask because there’s conflicting information on student forums.
That’s right, Frances. I’ll be all too happy to correct it if it’s incorrect.