

**Updated with information from released October 2026 PSAT scores as of November 6.**
If you’d like, jump right to the Compass Projections and State Explorer and then come back for the commentary.
The junior-year PSAT is also the National Merit Scholarship Qualifying Test (NMSQT). Each year, National Merit recognizes the top 55,000 test takers. To be included in that group, students must be among the top 4% of the 1.3 million eligible students who take the PSAT. Of that elite group, approximately 16,500 are recognized as Semifinalists for having the highest scores within their states. Semifinalists have the opportunity to continue in the program to become Finalists and, potentially, scholarship recipients. Some colleges provide significant scholarships and even full rides for Finalists. The remaining 39,000 students are recognized as Commended Students. More information can be found in our National Merit Explained post. If you are looking for Compass’s archived report on the class of 2027 results, find it here.
Calculating the Selection Index
National Merit uses the Selection Index (SI), found on the PSAT score report, to rank students. The Selection Index is calculated by doubling the Reading & Writing score (RW), adding the Math score (M), and dividing that sum by 10. For example, a student with a 720 RW score and a 700 M score has a Selection Index of 214: (720 x 2 + 700) ÷ 10. A student with a 700 RW and 720 M has a Selection Index of 212. The highest SI a student can receive is 228 (760 RW and 760 M). The weighting of the index means that not all students with the same Total Score have the same SI. “Will a 1450 qualify?” is not the right question. Instead, ask whether a student with a 750 RW and 700 M will qualify.
How Semifinalist cutoffs are set in each state
NMSC allocates a target number of Semifinalists to states based on their population of high school graduates, not all of whom take the PSAT. If Texas is allocated 1,500 Semifinalists based on its population of high school graduates, then NMSC works down from a perfect 228 Selection Index until it gets as close as possible to that target. In the class of 2027, 1,462 students scored at or above the cutoff of 219. A cutoff of 220 would have produced too few Semifinalists. A cutoff of 218 would have gone over the allocation. As scores go lower, more and more students occupy each level, and where the crowd forms does not stay consistent from year to year. It is easy for cutoffs to move up or down a point even when there is minimal change in testing behavior or performance. All students at or above a cutoff qualify.
Predicting scores for the class of 2028
The journey to National Merit is a long one. Semifinalists aren’t notified until September 2027, and Finalists might not hear until February 2028. Compass’s research aims to fill in some of the gaps during the long wait.
Approximately 80% of scores have been released by the first week in November. College Board only summarizes PSAT scores in broad ranges. The top range of 1400 to 1520 has proved to be an excellent indicator of the Commended cutoff and the overall trend in Semifinalist cutoffs.
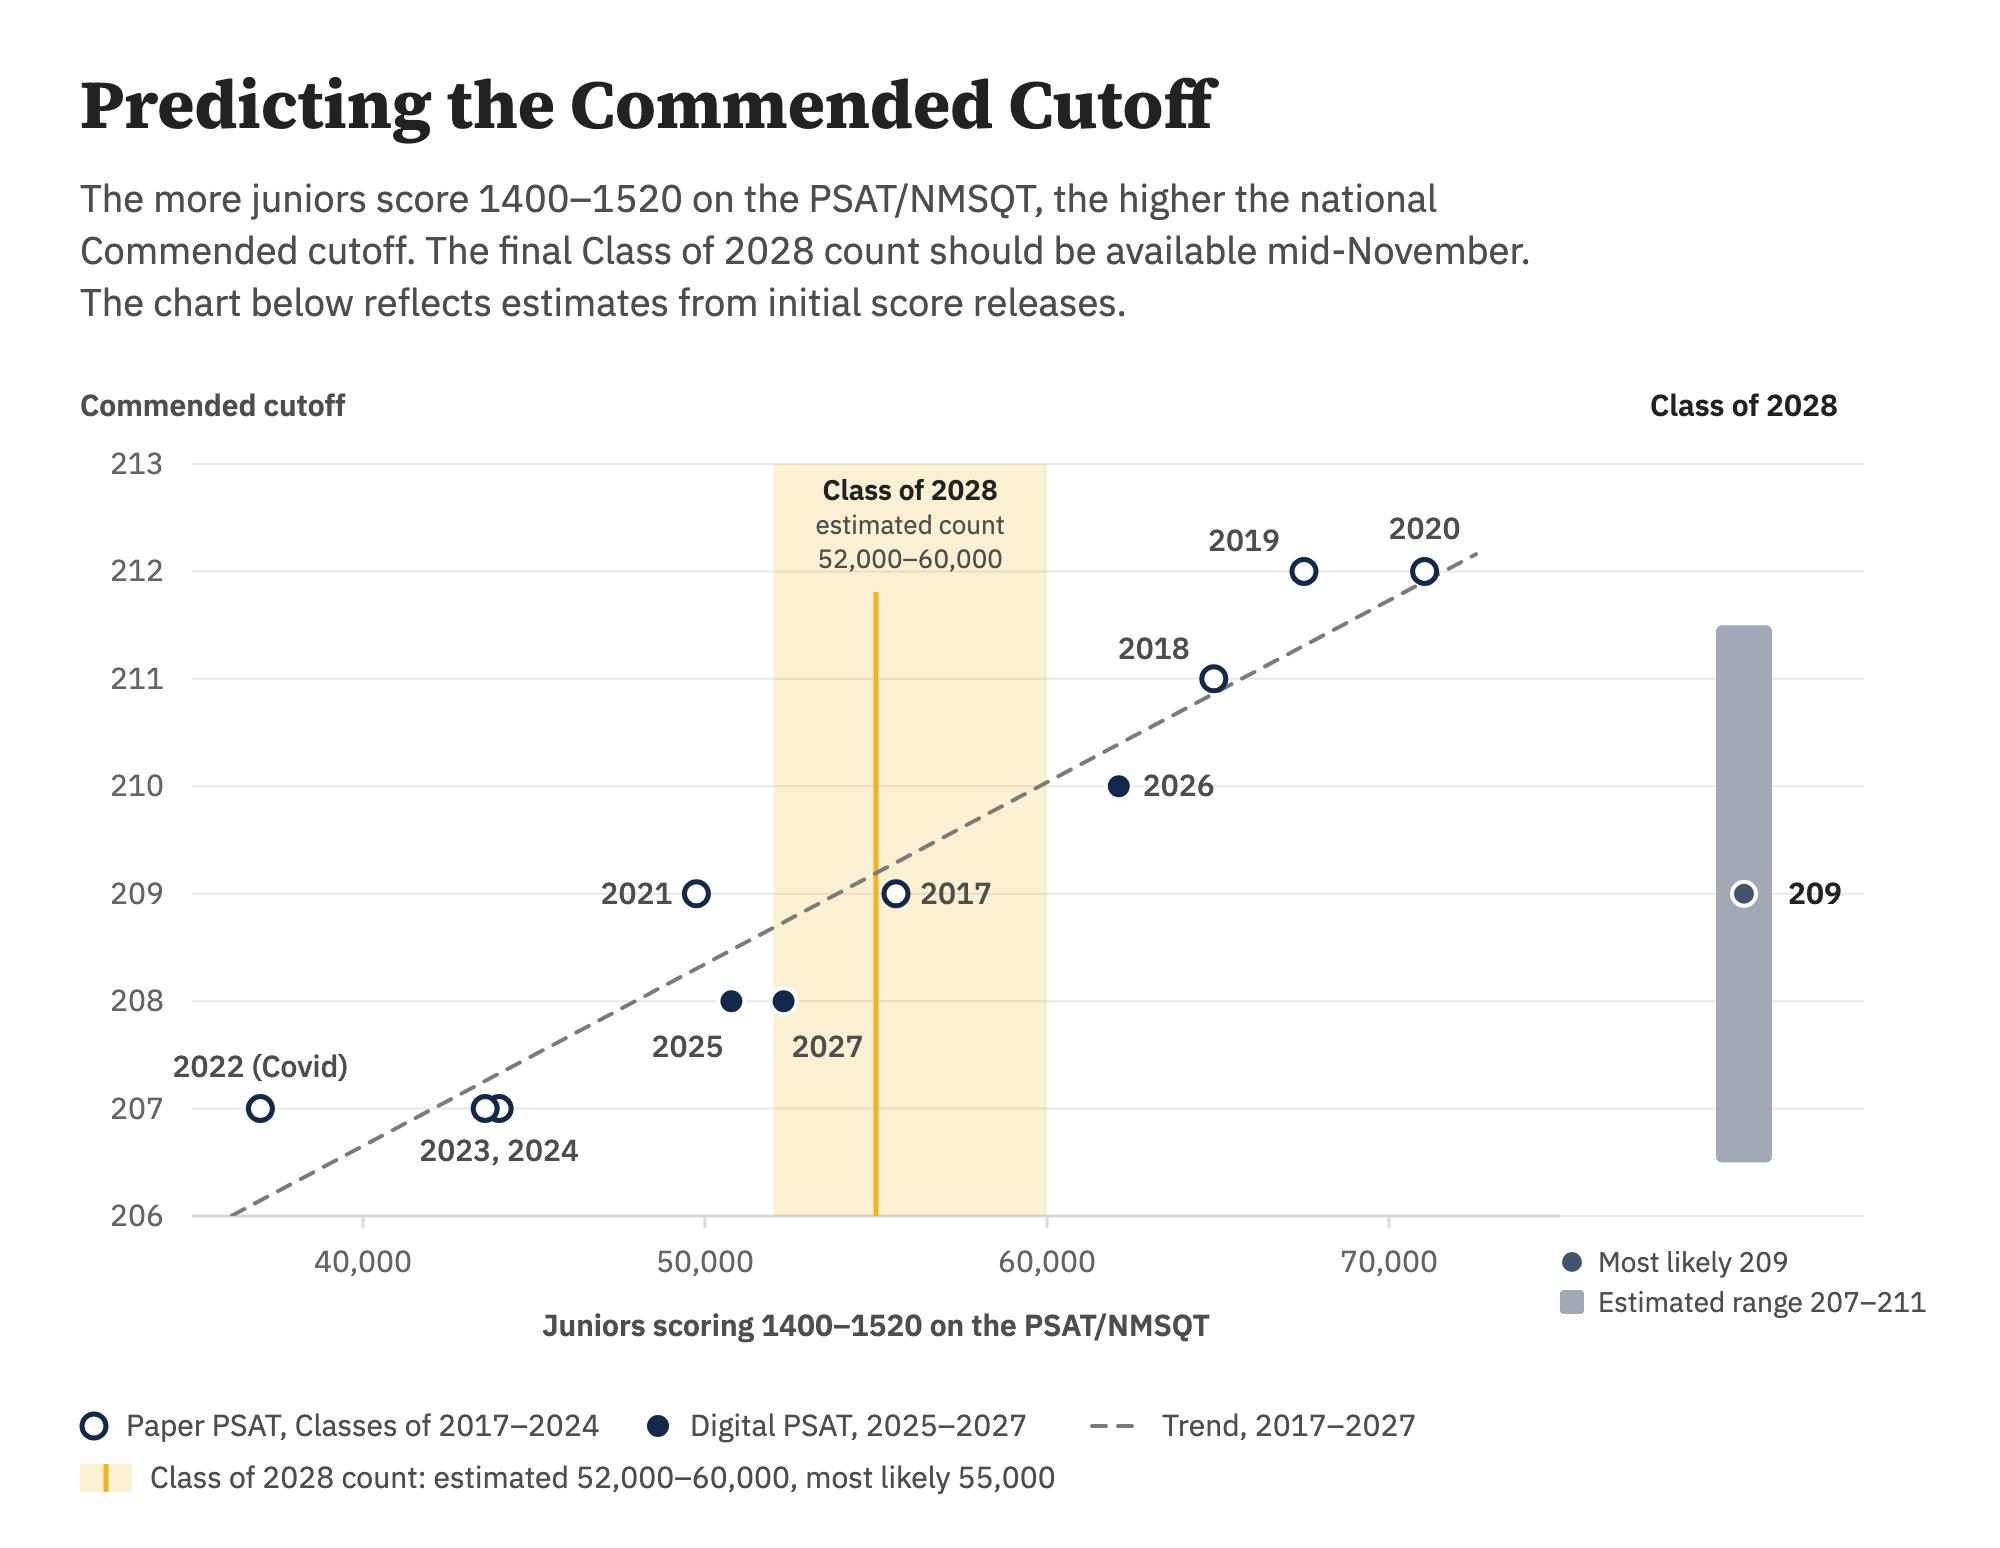
Based on the scores released to date, Compass expects between 52,000 and 60,000 students to score in the top range, with 55,000 as the most likely figure. That’s only modestly above the 52,300 in the class of 2027, which is why Compass projects this year’s most likely Commended figure to be 209. Compass’s model assumes, based on prior years, that later scores will skew lower than earlier scores. However, we don’t yet know how many scores will be released in the final score release wave. We retain the possible Commended range of 207 – 211 to allow for uncertainty.
Comparing RW and Math scores also suggests moderation this year
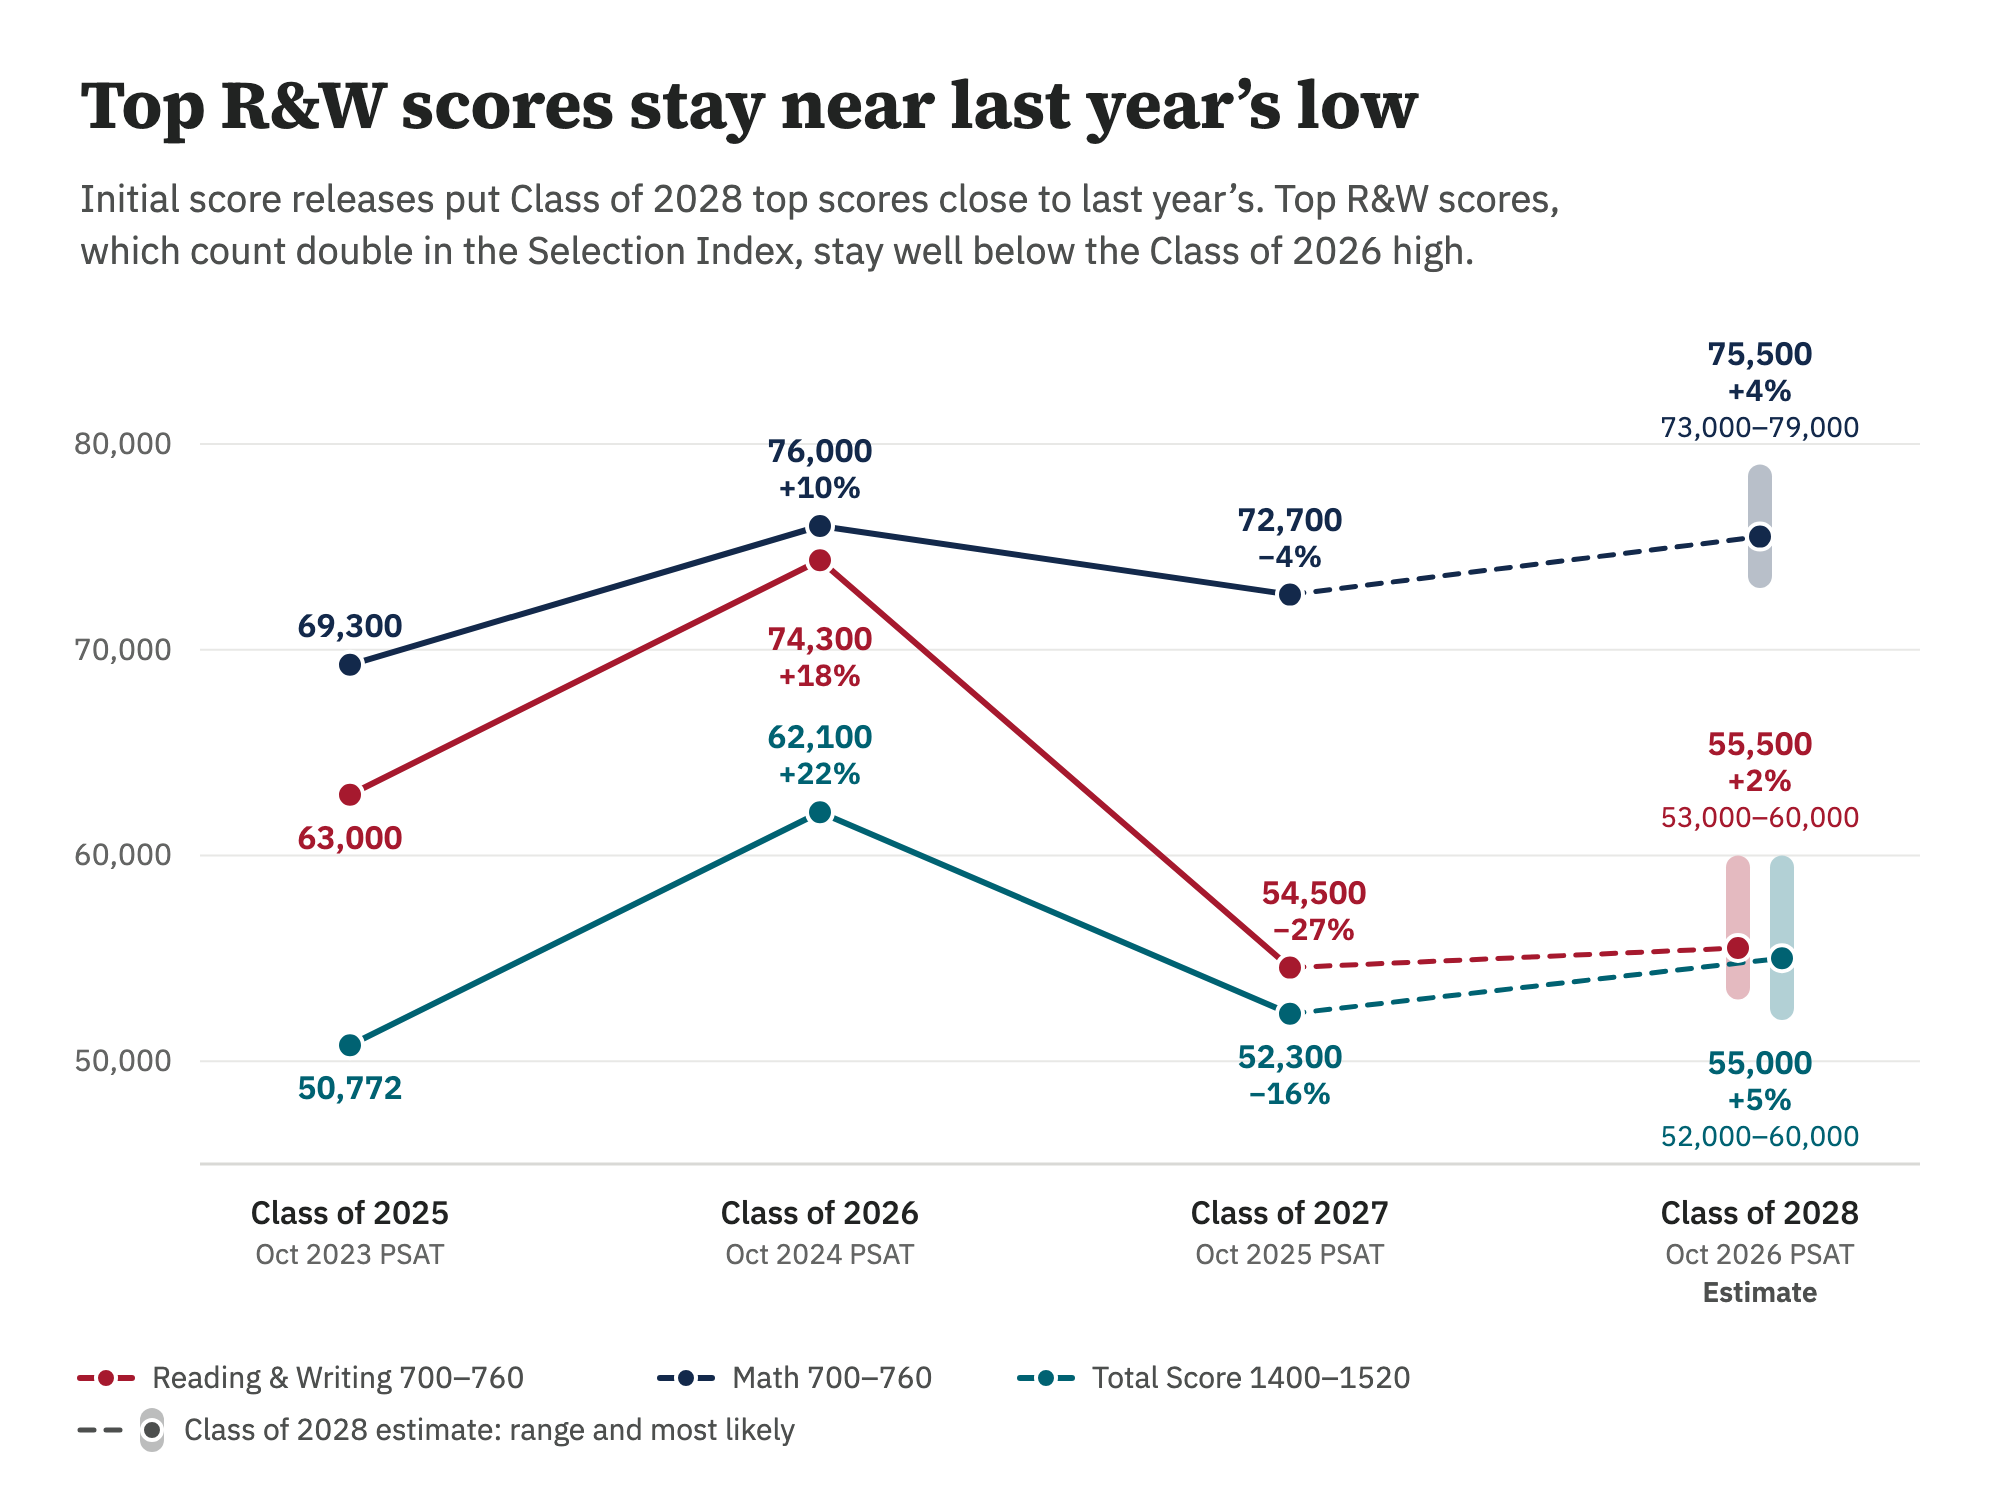
Students considering their odds of qualifying as National Merit Semifinalists often look in horror at the class of 2026 cutoffs, which were among the highest recorded since the revised PSAT was introduced for the class of 2017. Compass has shown that those high cutoffs can likely be attributed to poor scaling of the RW section on the 2024 PSAT. Because RW receives double weight in the Selection Index, the scaling problem had an outsized impact on cutoffs, with New Jersey’s reaching 225. The good news is that this year’s results look more like those from the classes of 2025 and 2027 than they do those from the class of 2026. There are more high Math scores than RW scores (about a 1.33 to 1 ratio), which should keep the highest cutoffs in check. On average, Semifinalist cutoffs may see some upward movement, but there is no evidence of a spike.
Below is a chart of RW, Math, and Total scores over the 3 prior years, with estimates for the class of 2028. Final numbers should be available by November 13.
Did I make it?
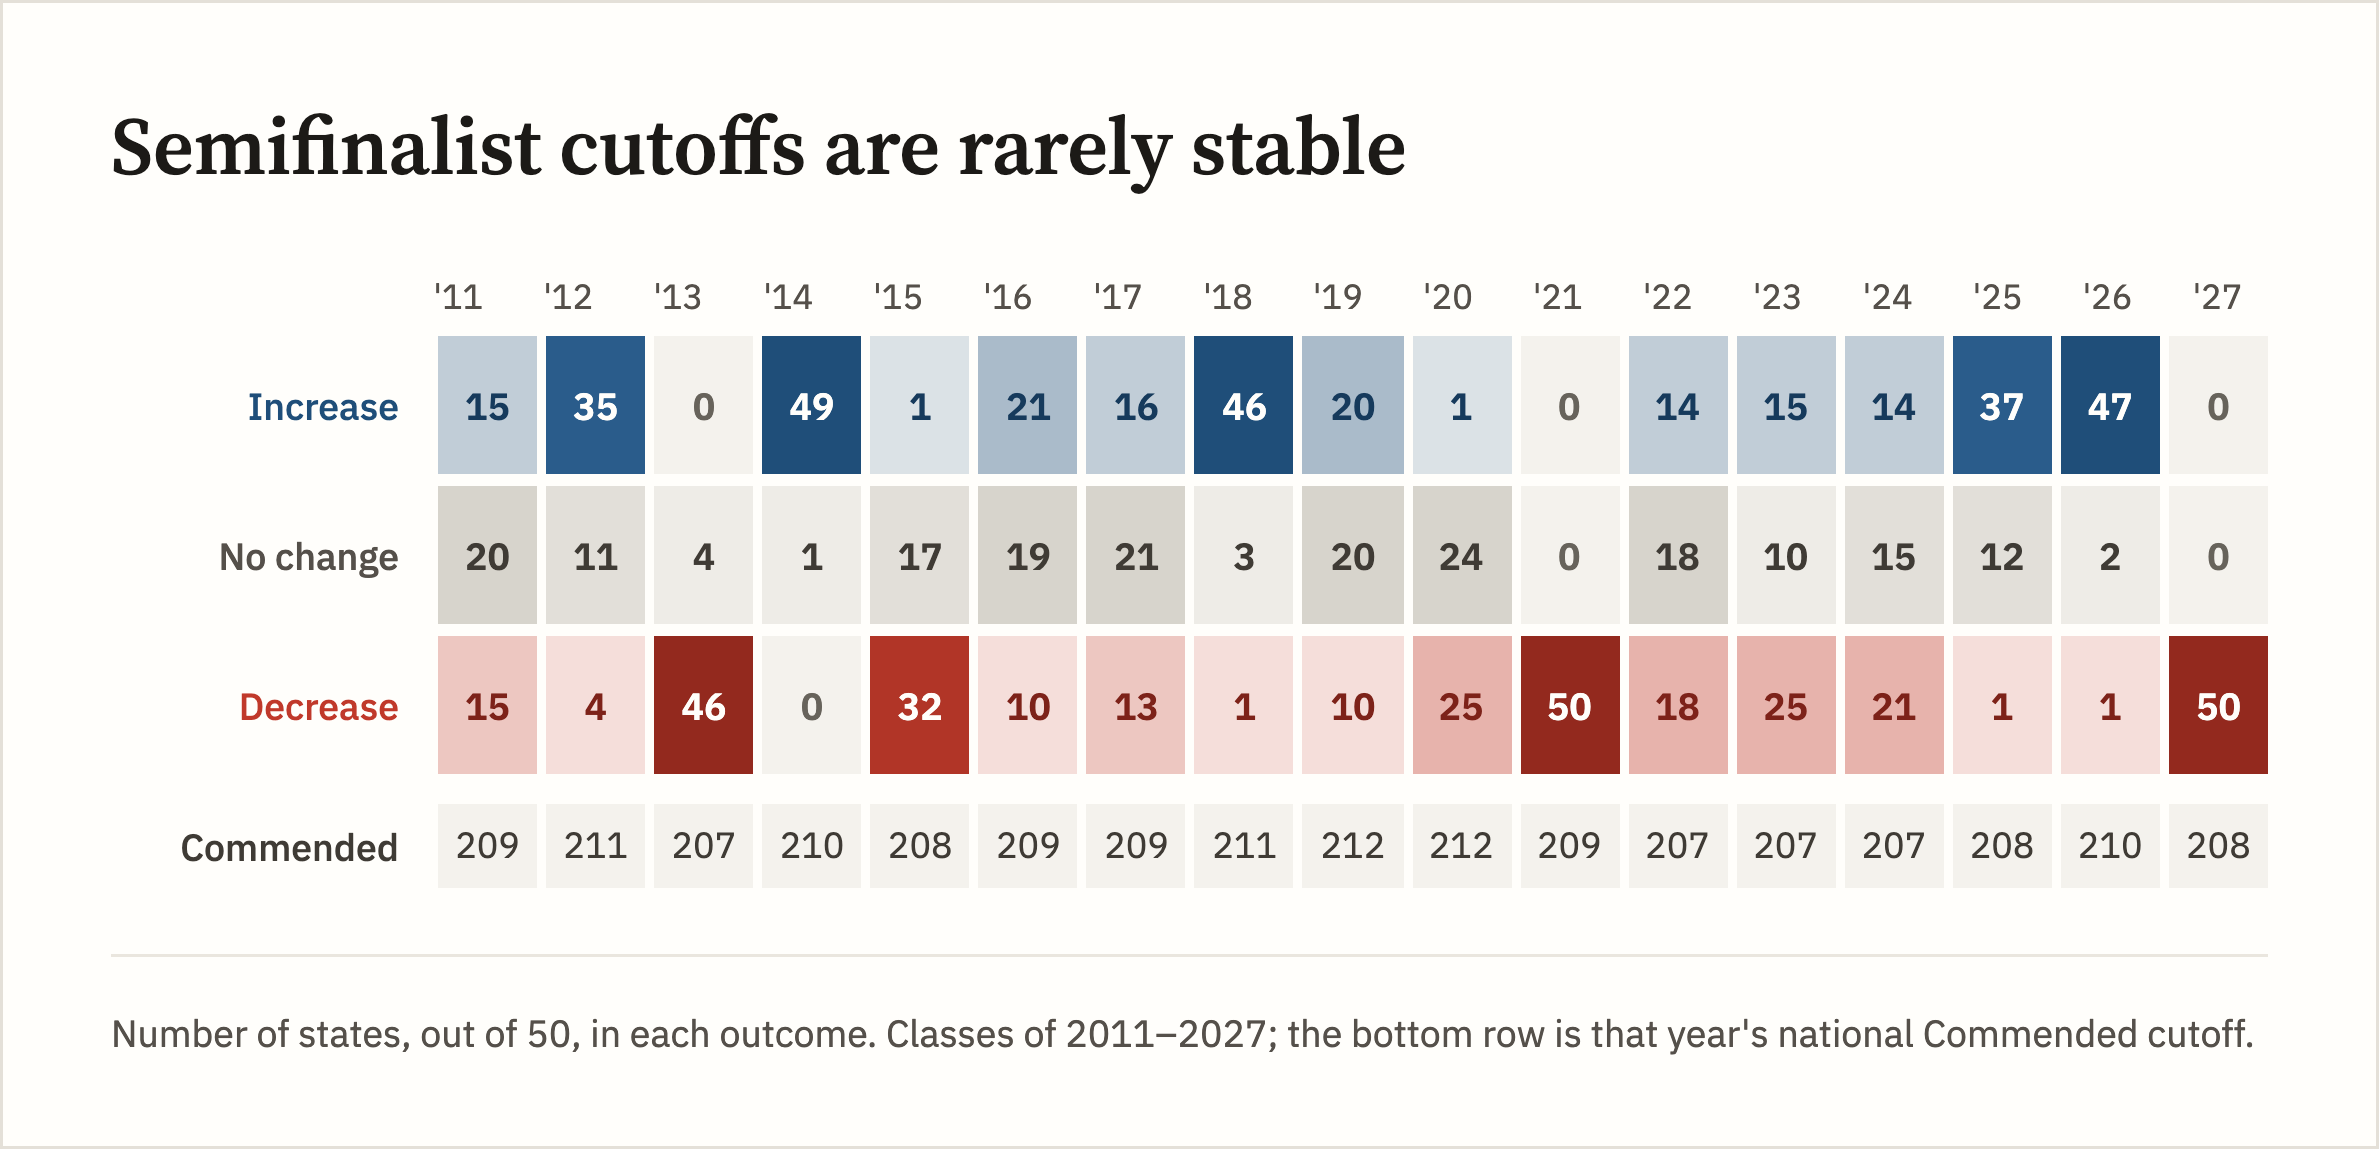
A student’s natural instinct is to look at the prior year’s cutoff and ask, “Did I make it?” The historical record shows the shortcomings of that strategy. From the class of 2011 to the class of 2027, there has never been a year in which even half of the state cutoffs remained unchanged. Even with the added insight of national results, students should consider the likely range of cutoffs rather than focusing on a single score.
Semifinalist trends over time
In October 2015, the PSAT moved to a 320–1520 scale, which was set to provide vertical alignment with the SAT’s 400–1600 scale. The class of 2017 was the first group of students taking the redesigned PSAT/NMSQT, so the fairest comparisons are among the last eleven graduating classes.
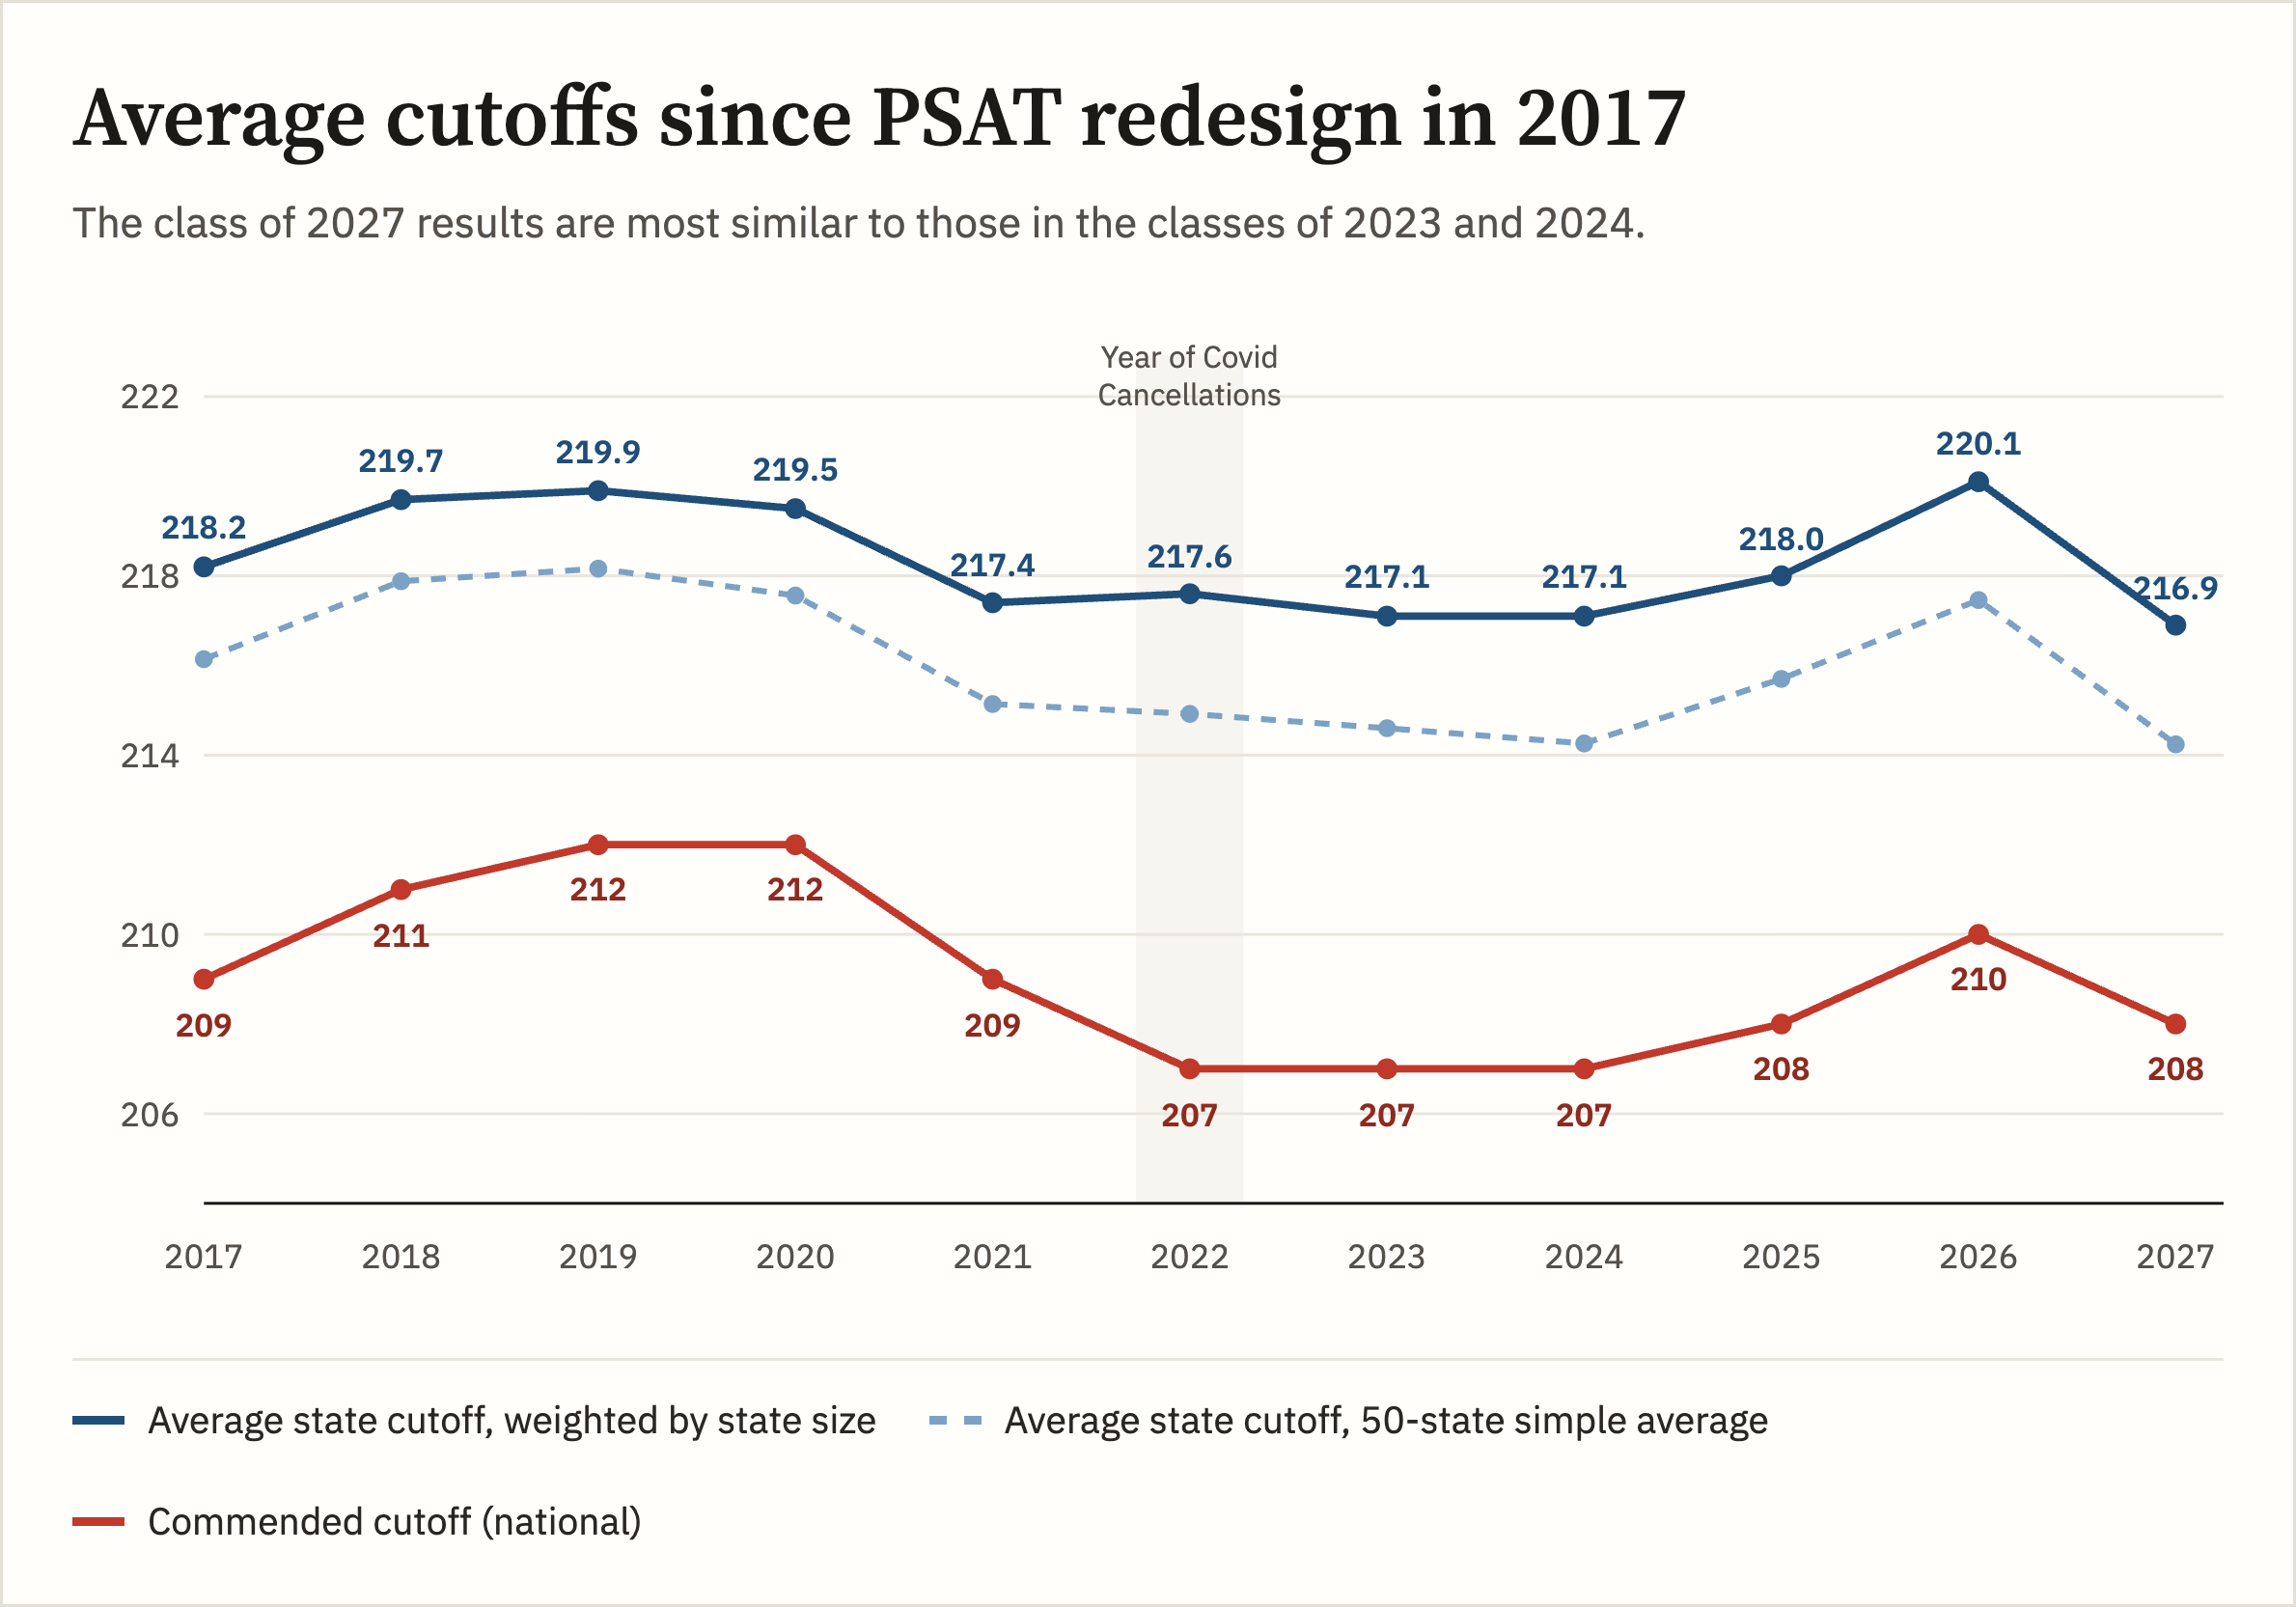
Note how the Commended cutoff and state averages tend to track one another in the chart above. The chart below shows that there is more volatility in individual states, and more volatility in smaller states, but few states move against a rise or fall in the Commended level. We cannot assume, however, that the magnitude of the change will always be the same. We have an estimate of the Commended cutoff — a suspected 1-point increase — but won’t have confirmation until April.
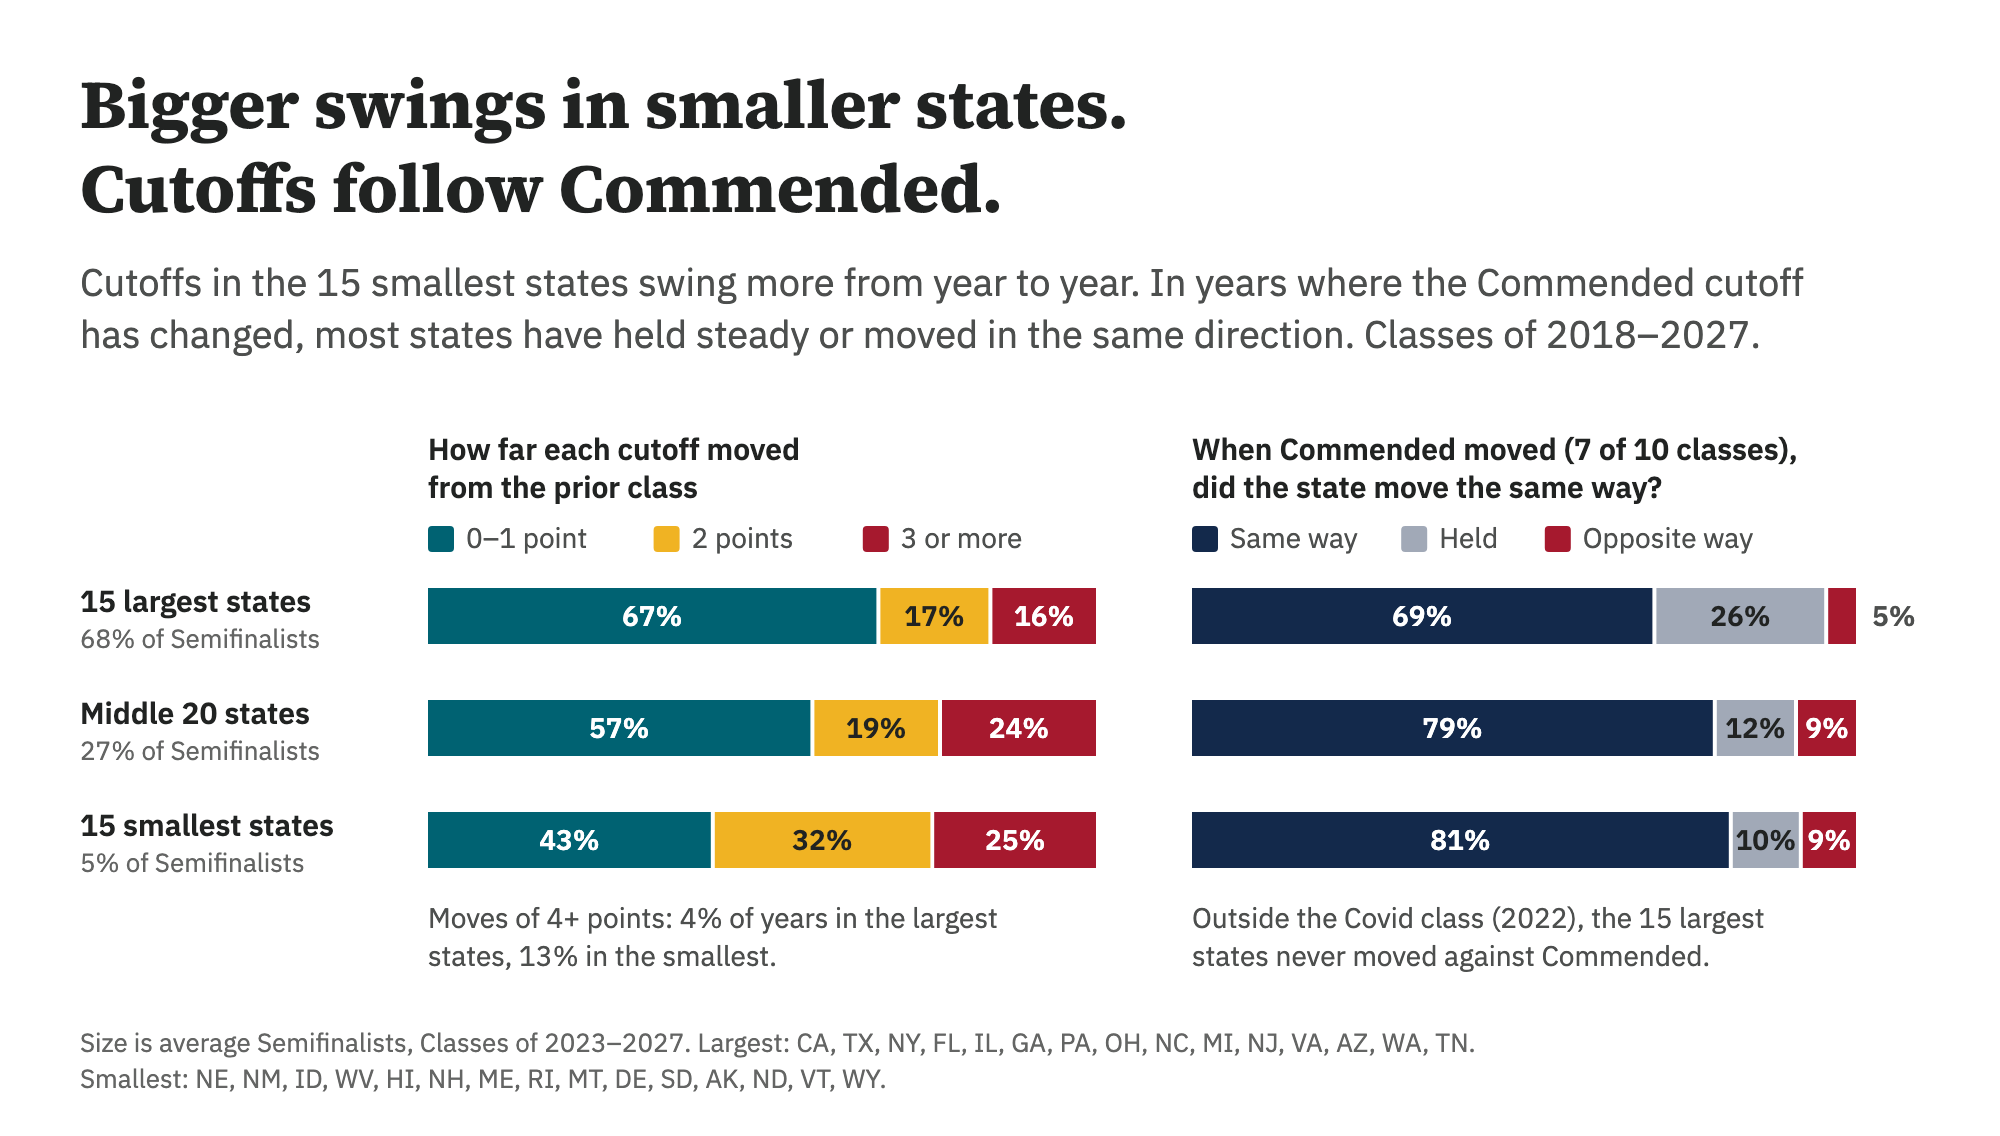
Projections for the class of 2028: Consider the ranges.
In addition to our 50-state cutoff projections, Compass provides a deep dive into each state. Enter your own Selection Index or section scores to see how you stack up historically. The estimates consider state size, prior cutoffs and volatility, and Commended values.
As of 11/6/26, forecasted ranges combine historical data with early PSAT score information. The Commended cutoff will be confirmed in April.
Class of 2028 estimates by state
| State | Class of 2028 estimate | Past cutoffs | |||
|---|---|---|---|---|---|
| Most likely | Estimated range | 2027 | 2026 | 2025 | |
| Alabama | 212 | 210–214 | 210 | 214 | 212 |
| Alaska | 211 | 209–214 | 208 | 215 | 214 |
| Arizona | 216 | 214–218 | 215 | 218 | 217 |
| Arkansas | 212 | 210–214 | 210 | 215 | 213 |
| California | 221 | 220–223 | 220 | 224 | 221 |
| Colorado | 217 | 216–219 | 217 | 219 | 218 |
| Connecticut | 221 | 219–222 | 220 | 223 | 221 |
| Delaware | 219 | 216–221 | 219 | 220 | 219 |
| District of Columbia | 223 | 222–224 | 223 | 225 | 223 |
| Florida | 217 | 215–218 | 216 | 219 | 217 |
| Georgia | 218 | 216–219 | 217 | 220 | 218 |
| Hawaii | 217 | 215–219 | 218 | 219 | 217 |
| Idaho | 213 | 210–215 | 211 | 215 | 213 |
| Illinois | 219 | 218–221 | 218 | 222 | 220 |
| Indiana | 216 | 214–218 | 215 | 218 | 217 |
| Iowa | 211 | 209–213 | 210 | 214 | 212 |
| Kansas | 214 | 212–216 | 212 | 216 | 215 |
| Kentucky | 212 | 210–214 | 211 | 214 | 213 |
| Louisiana | 213 | 211–215 | 211 | 216 | 214 |
| Maine | 214 | 212–217 | 214 | 217 | 214 |
| Maryland | 222 | 220–223 | 221 | 224 | 222 |
| Massachusetts | 222 | 221–224 | 221 | 225 | 223 |
| Michigan | 217 | 216–219 | 216 | 220 | 218 |
| Minnesota | 216 | 214–218 | 214 | 219 | 217 |
| Mississippi | 211 | 209–213 | 211 | 213 | 212 |
| Missouri | 215 | 213–217 | 214 | 217 | 215 |
| Montana | 209 | 208–212 | 208 | 213 | 209 |
| Nebraska | 212 | 210–214 | 212 | 214 | 211 |
| Nevada | 212 | 210–214 | 211 | 214 | 214 |
| New Hampshire | 216 | 214–218 | 215 | 219 | 217 |
| New Jersey | 223 | 222–224 | 223 | 225 | 223 |
| New Mexico | 209 | 208–211 | 209 | 210 | 211 |
| New York | 220 | 219–222 | 220 | 223 | 220 |
| North Carolina | 218 | 216–219 | 217 | 220 | 218 |
| North Dakota | 209 | 207–211 | 208 | 210 | 210 |
| Ohio | 217 | 215–218 | 216 | 219 | 217 |
| Oklahoma | 210 | 208–212 | 210 | 212 | 211 |
| Oregon | 217 | 215–219 | 216 | 219 | 216 |
| Pennsylvania | 219 | 217–220 | 219 | 221 | 219 |
| Rhode Island | 216 | 213–218 | 213 | 219 | 217 |
| South Carolina | 213 | 211–215 | 212 | 215 | 214 |
| South Dakota | 210 | 208–212 | 210 | 211 | 208 |
| Tennessee | 216 | 214–218 | 214 | 219 | 217 |
| Texas | 219 | 218–221 | 219 | 222 | 219 |
| Utah | 211 | 209–213 | 209 | 213 | 211 |
| Vermont | 213 | 210–216 | 212 | 216 | 215 |
| Virginia | 221 | 220–223 | 221 | 224 | 222 |
| Washington | 221 | 220–223 | 221 | 224 | 222 |
| West Virginia | 209 | 207–211 | 208 | 210 | 209 |
| Wisconsin | 213 | 211–215 | 212 | 215 | 214 |
| Wyoming | 209 | 207–211 | 208 | 210 | 209 |
| U.S. Students Abroad | 223 | 222–224 | 223 | 225 | 223 |
| U.S. Territories | 209 | 207–211 | 208 | 210 | 208 |
| Commended (national) | 209 | 207–211 | 208 | 210 | 208 |
Below are three of the most popular (and controversial) questions I get asked about the National Merit Scholarship Program. A couple of less controversial questions follow. Additional information can be found in our National Merit FAQ.
Why does each state have its own Semifinalist cutoff if the program is NATIONAL Merit?
This is always a hot-button question. NMSC allocates the approximately 16,500 Semifinalists among states based on the number of high school graduates. That way, students across the nation are represented. It also means that there are very different qualifying standards from state to state. A Massachusetts student with a 220 might miss out on being a Semifinalist. If she lived just 10 miles away in New Hampshire, she would qualify.
No Semifinalist cutoff can be lower than the national Commended level. Cutoffs for the District of Columbia and for U.S. students studying abroad are set at the highest state cutoff (typically New Jersey). The cutoff for students in U.S. territories and possessions falls at the Commended level each year. Boarding schools are grouped by region. The cutoff for a given region is the highest state cutoff within the region.
NMSC feels that the allocation method is the best way of ensuring truly national representation. That’s important, because without national representation, the program would likely not exist. National Merit requires participation from corporations and universities across the country. It constantly works to foster investment. Looking at the sponsors from 35 years ago, for example, shows just how much things change. The pitch to sponsors would be more difficult if Semifinalists were clustered in a smaller footprint. That doesn’t make the frustration any less real for the students who miss out.
When are National Merit Semifinalists announced? Why does it take so long?
The lists of Semifinalists will not be distributed to high schools until the end of August 2027. With the exception of homeschoolers, students do not receive direct notification. NMSC asks that schools not share the results publicly until the end of the press embargo in mid-September, but schools are allowed to notify students privately before that date. NMSC does not send Commended Student letters to high schools until mid-September. Compass will keep students updated on developments as the dates approach.
NMSC is an organization that values consistency — maybe sometimes to excess. The Semifinalist, Finalist, and Scholar cycle is little changed from what it was 60 years ago. Originally the NMSQT was in the spring of junior year, and email and the internet didn’t exist. Once the PSAT and NMSQT merged into a single exam, testing moved to the fall of junior year. The notification calendar never changed. During the winter and spring, NMSC is busy working with Finalist and Scholar selections. And counselors are busy getting seniors into college! In April and May, schools need to sign off on student eligibility. NMSC has always worked through schools for Semifinalist notifications, so September provides the next logical window. It’s slow and secretive, but it eventually works.
The schedule is hardest on students hoping to get one of the large scholarships offered by a limited number of universities. Key planning gets put on hold. I’d also like to see NMSC modernize its notification process. In the age of Bluebook, there is no excuse not to notify students directly and avoid the uncomfortable rollout of information. Colleges have long learned how to operate this way and build enthusiasm. The days of National Merit students being written up by the local newspaper are long gone, so why not let Instagram and TikTok take over?
Why is RW given twice the weight of Math?
There are many wrong answers to this question floating around the internet. It’s not because the PSAT had separate Reading and Writing sections during the SAT’s 2400 period. The weighting existed decades before that version of the exam. It’s not to favor one demographic over another. It dates back to the very creation of the test. In fact, the current method is more balanced than the original!
The National Merit Scholarship Qualifying Test (just the SQT in 1956 and 1957) was originally a separate test offered in the spring of junior year. The test was developed from the Iowa Testing Programs that also gave birth to the ACT. In fact, the NMSQT looked a lot like the original ACT. It had sections for English, Mathematics, Social Studies (Reading), Natural Sciences (Reading), and Vocabulary. Each section was scored 1-36, and the Selection Index was the sum of the five section scores. So 80% of the original Selection Index came from sections testing verbal skills. In 1971, NMSC merged the NMSQT with the College Entrance Examination Board’s PSAT, written by ETS. The PSAT and SAT only had Verbal and Mathematics scores (20-80 on the PSAT and 200-800 on the SAT). In order to keep a similar balance to the original NMSQT, the Verbal score was doubled to form the Selection Index.
The decision remains controversial, but its roots are 70 years old. As mentioned previously, NMSC likes continuity.
Do state and national percentiles indicate whether a student will be a National Merit Semifinalist?
No! Approximately 1% of test takers qualify as Semifinalists each year, so it is tempting to view a 99th percentile score as indicating a high enough score — especially now that College Board provides students with percentiles by state. There are several flaws in using percentiles as a quick way of determining National Merit status.
- Percentiles are based on section scores or total score, not Selection Index
- Percentiles are rounded. There is a large difference, from a National Merit perspective, between the top 0.51% and the top 1.49%
- Percentiles reveal the percentage of students at or below a certain score, but the “at” part is important when NMSC is determining cutoffs.
- The number of Semifinalists is based on the number of high school graduates in a state, not the number of PSAT takers. Percentiles are based on PSAT takers. States have widely varying participation rates.
- Most definitive of all: Percentiles do not reflect the current year’s scores! They are based on the prior 3 years’ performance. They are set even before the test is given. And if you are going to use prior history, why not use the record of prior National Merit cutoffs rather than the highly suspect percentiles?
When my score report says “Eligible for National Merit,” does that mean I qualify?
Eligibility means entering the program; qualifying comes later. Your PSAT/NMSQT score report tells you whether you meet the eligibility requirements for the NMSP. In general, juniors taking the October PSAT are eligible. If you have an asterisk next to your Selection Index, it means that your answers to the entrance questions have made you ineligible. Your answers are conveniently noted on your score report. If you think there is an error, you will also find instructions on how to contact NMSC. Meeting the eligibility requirements simply means that your score will be considered. Approximately 1.3 million students from the 1.4 million PSAT takers enter the competition each year. Only about 55,000 students will be named as Commended Students, Semifinalists, Finalists, or Scholars. See National Merit Explained for more information.

My son in Iowa is a semi-finalist with a 219.
Thank you for sharing this, Kellie. Congratulations to your son!
So bummed to hear about NJ cutoff. My son at 222 will not qualify then ☹️
New Jersey’s cutoff can be demoralizing. Your student did splendidly, and I’m sure he has done well on the SAT.
Art – what’s your best estimate of how many 228 index scores are there each year?
SG,
I haven’t tried to compute it recently. College Board’s data doesn’t go granular enough, but based on distribution estimates, I believe I pegged things at between 0.05% and 0.1% of test takers. So probably 1,000 – 1,500 students.
Any info from MD? My son got a 220 and was disappointed for half a year. But it seems some hope this year? Thanks.
I’m afraid that the information I have for him will be disappointing. MD will come in at 221 this year.
Do you think the 223 for U.S. citizen studying abroad category will qualify for SF status given NJ is 223 and MD 221? Again, thank you.
Anon,
Yes, 223 will qualify.
Hi Art,
Is this score cutoff confirmed? There are no updates about this in the BREAKING section or any other indication you provided about this cutoff. Would greatly appreciate the info!
Menelik,
Yes, the Maryland cutoff is confirmed at 221.
Thanks, Art. Didn’t see this shown above in your updates for today but it’s good to know the MD cutoff is also confirmed. This site is a wonderful resource. My daughter has a 223 in MD and we are anxiously awaiting a formal confirmation from her school.
She should hear this week or next (the 9/13 press release date).
Art – FYI, Maryland is missing from your list above.
Fixed. Thank you!
Hi Mr. Sawyer,
Are there multiple and verifiable reports for ≤221 in California? Scored 221 and afraid to get my hopes up too fast.
Yes, I am confident of 221 in CA. Congratulations!
Any news on a 220 cutoff for CA?
The cutoff is 221 this year.
It is crazy that NJ’s is at least 2 higher than CA.
You haven’t heard yet if 220 is a yay or nay in CA, correct? Crossing our fingers, thanks!
Jean,
Unfortunately CA’s cutoff is at 221 this year.
What do you think the chances are with a 214 in WI?
I think 214 will qualify in Wisconsin.
Any info on KY please?
AB,
Kentucky’s cutoff has dropped a point to 211.
Hi Art!
I got a 220 in CA this year. What would you say are my chances?
Ash,
We’ve now confirmed the cutoff is at 221 for CA.
Hi Art
Have you received any final confirmation for Texas ?
Thank you for all you do.
Tom
Tom,
Yes, Texas will remain at 219 this year.
Do you think my son who got a 220 could get California?
John,
Unfortunately, California’s cutoff is now confirmed at 221.
Should I contact our school next week if we haven’t heard from them? I am in Alabama and my son has a 223 but no word yet from the school. Is it possible that they think the National Merit Corporation will contact him or does the Corporation make it clear to the school that they have to inform the student?
Ash,
Many schools wait until the press release date of September 13 to distribute National Merit information to students. It’s not at all unusual that your son has not yet received word from his school. I would wait until the 13th or 14th to contact them. Your son will clearly qualify as a Semifinalist, so I would rest easy. NMSC won’t confirm his qualification until after the press release date, but you can also call them at that point. They’ll still point you back to the school get the letter with your son’s instructions for next steps. And, congratulations!
Thanks so much for the thorough and informative response. I didn’t realize that about the press release. Very excited about the possibilities this opens up for our small town Alabama boy!
It is sad that my son missed the cut off by 1 point for CA, he has 760 for math but 720 for the reading, which decreased his overall score. If his math is at 740 and reading is at 740, then he would be scored at 222. How odd the calculation is! Thank you for the info!
Liz,
Congratulations on your son’s perfect PSAT Math score. Yes, the scoring can be particularly unforgiving in states with high cutoffs.
Are there multiple and verifiable reports for ≤210 in Oklahoma?
Ivan,
Currently we have a report of a 210 qualifying. I’m not in a position to check IDs, but the report is credible.
Hi,
Is there any update on whether a 220 on California will qualify for semifinalist?
John,
A 220 will fall just short this year. California’s cutoff is confirmed at 221.
Would be nice to know WA cutoff; resigned to son’s 219 probably not making it (and not too concerned; it is a nice honor but not as important as it used to be), but as John Cleese said in Clockwork; “It’s not the despair. I can take the despair. It’s the hope!”
Anonymous,
Thank you for the Cleese reference! Alas, Washington’s cutoff is confirmed at 220.
You might want to update in the the list if it is confirmed (still at > or =). Also, the movie is Clockwise not Clockwork, but the quotation is still valid! Thanks for taking the time to get this info out.
Updated. Thank you!
Art, any info on NH?
FCinNH,
I’ve heard from a student with a 214 in NH who did not qualify. This means the cutoff is 215 or higher.
Thanks Art. So what are the chances for 215 qualifying in NH? Thanks!
I’d say it’s 90%+.
Hi Mr. Sawyer,
Are there multiple reports for 219 as the cut off in Texas?
SA,
Yes, 219 is confirmed as the Texas cutoff.
Is it at all possible for a cutoff score of 216 in Illinois? Should I keep my hopes up?
Haroldas,
I’m afraid that Illinois’ cutoff will be higher than 216 this year.
But the Illinois cutoff is for sure 219, as reflected above? Just making sure, since I haven’t seen any comments or Reddit posts reflecting that. My kid will miss it by 1, looks like 🙁
Yes, the 219 cutoff is confirmed. I’m sorry to hear that your student missed out.
I am in california and received 220. Is 221 confirmed?
MA,
221 is confirmed.
So based on the stats above, a 222 SI is confirmed for MA and will be NMSF? Thanks!
David,
That’s correct. A 222 qualifies for NMSF in MA.
Any word about selection index for the state of Oregon?
Waiting anxiously …
Waiting here, too.
Have you received any reports from WI? What are the chances with a 213? Thanks!
Lucey,
I’m confident that 213 will hold up in WI. Congratulations!
How confirmed is this? Do you have any reports on Wisconsin yet or is this just an assumption that it will not increase considering the outcomes of the rest of the country? Just want to have concrete confirmation because there was an issue with the wrong school being reported on my PSAT, so my school may or may not receive my letter and info. My counselor said she was working on it, but nothing has changed in my college board portal.
Lucey,
Reports confirm Wisconsin at 213.
As of the 13th, you should be able to call NMSC and clarify your status. The press releases also organize students by school. If one of the Wisconsin papers prints the whole list, you’ll find there how they have assigned you. I wouldn’t worry much quite yet. The CB Portal is not the same as what NMSC uses.
What do you think of a 217 in Michigan?
Alex,
I think you’ll be receiving a letter from your school as a NMSF.
Any word on Arkansas? Will a 210 be good enough?
Mark,
Yes, 210 will work in Arkansas!
Hi Mr. Sawyer! My son received a selection index of 216 in South Carolina. Since it looks like the cutoff score will be 210, I’m guessing that he will be a semi-finalist. What are your thoughts?
Gen,
The SC cutoff is 210 or lower, so your son’s 216 will qualify. Congratulations!
have your confirmed cutoffs ever changed? how confirmed is confirmed -i.e is a reddit post assumed to be true? am thinking about CT specifically, but also thinking in general.
thx
John,
CT’s cutoff is confirmed confirmed at 221.