
Compass projects lower qualifying scores for the Class of 2027
The junior year PSAT is also the NMSQT — the National Merit Scholarship Qualifying Test. Each year, National Merit recognizes the top 57,000 test takers. In order to be included in that group, students need to be among the top 4% of the 1.4 million students who take the PSAT. Of that elite group, approximately 17,000 are recognized as Semifinalists for having the highest scores within their states. Semifinalists have the opportunity to continue in the program to become Finalists and, potentially, scholarship recipients. The remaining 40,000 students are recognized as Commended Students. More information can be found in our National Merit Explained post.
For the Class of 2027, the exact scores needed to qualify (“cutoffs”) will not be released until September 2026 (the Commended cutoff is likely to leak in April). In order to give students context for their test results, Compass has analyzed the scores from the October 2025 to produce estimates for the national Commended cutoff and the individual state cutoffs. We predict that the majority of state cutoffs will decline this year.
National Merit uses the Selection Index (SI), found on the PSAT score report, to rank students. The Selection Index can be calculated by doubling the Reading & Writing score (RW), adding the Math score (M), and dividing that sum by 10. For example, a student with a 720 RW and 700 M score has a Selection Index of 214 — (720 x 2 + 700)/10. The weighting of the index means that not all students with a 1420 Total Score have the same SI. A student with a 700 RW and 720 M has a Selection Index of 212. The highest SI a student can receive is 228 (760 RW and 760 M). Last year, the Commended cutoff was 210, and Semifinalist cutoffs ranged from 210 to 225 depending on the competitiveness of the state.
Why do we foresee lower cutoff scores?
College Board does not release any information about the distribution of Selection Indexes, but it does produce summaries of broad score ranges. The number of students in the 1400 – 1520 Total Score range has proved to be an excellent indicator of the Commended cutoff. The Class of 2027 saw 16% fewer top scores than did last year’s class. The 52,400 students at 1400 and above is closer to what we saw two years ago with the Class of 2025 and, going back further, similar to the results for the Classes of 2017 and 2021.
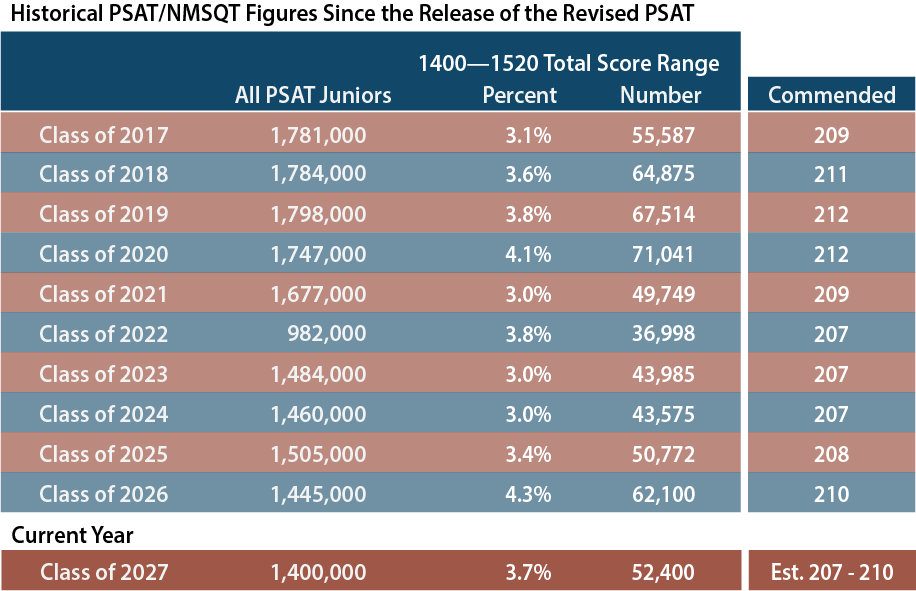
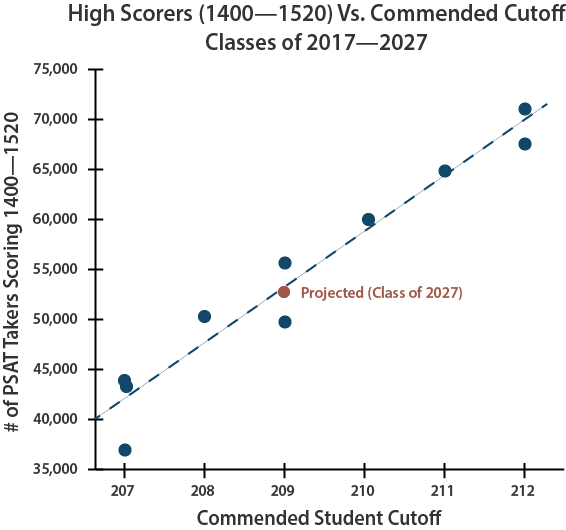
Most of the students who will qualify for National Merit recognition fall in the 1400 – 1520 band (or just outside it). With approximately 10,000 fewer students in the top band of scores this year, we expect the Commended level to drop to 208 or 209. The chart below shows the historical relationship between high scores and the Commended cutoff.
Explaining why last year’s cutoffs reached record levels
After examining this year’s numbers, we also have a better understanding of why Semifinalist cutoffs jumped to such extreme levels last year, and why it should not happen again. The 2024 PSAT saw an unprecedented 18% jump in the number of high Reading & Writing scores (700-760). The weighting of RW in the Selection Index magnified the impact of that change. The table below shows scores for the last three years and how results have fluctuated.

On the 2025 PSAT, the number of high RW scores dropped by 27%. In fact, the RW count for this year is even lower than it was two years ago. The decline in RW scores could even produce Selection Indexes lower than those in the Class of 2025 — at least in some states. The Commended cutoff may provide additional insight in the spring.
The ratio of 700+ M scores to 700+ RW scores reveals just how bizarre last year’s spike was. Traditionally, Math scores have higher distributions at the extremes. There are more very high Math scores on the PSAT and SAT, and there are more very low Math scores.

On the October 2024 PSAT, though, almost as many students scored 700-760 on RW as did on Math. The ratio of high Math scores to high RW scores was 1.02. This helps explain why some cutoffs went as high as 224 and 225 for the first time ever. Students achieved 750 and 760 RW scores in record numbers. In most years, there would be more students scoring 730 RW and 760 M (222 SI), for example, than scoring 760 RW and 730 M (225 SI). That was not true in the the Class of 2025, where there was a more equal distribution. It appears that scores for the Class of 2027 have returned to the traditional Math-heavy distribution. The ratio of high Math scores to high RW scores was 1.33 on the 2025 PSAT/NMSQT. For this reason, we don’t believe we will see a repeat of the 224 and 225 cutoffs seen last year.
Was last year a fluke, shift, or a trend?
The results from the Class of 2027 have answered one of the nagging questions from last year: Were the high cutoffs a fluke, shift, or trend? The answer appears to be fluke. More accurately, results could be labeled an error in test construction and scaling. There is no evidence that the Class of 2026 possessed special test-taking skills. As sophomores, that class performed in line with expectations on the 2023 PSAT. There is no evidence that the Class of 2027 has diminished skills. As sophomores, the class saw the same inflated scores as did the juniors on the 2024 PSAT. The best explanation is that College Board lost control of the scale. College Board dramatically shortened the PSAT when it switched from paper to digital. On the paper test, the Reading and Writing sections had 91 questions, and students were given 95 minutes. The RW on the digital PSAT is truncated to 54 questions over 64 minutes. And only 50 of the questions count toward a student’s score! A shorter exam means a less reliable exam. We saw the occasional wild ride on the paper PSAT, but the rides may get wilder and more frequent on the digital PSAT.
We anticipate the majority of state Semifinalist cutoffs to decline for the Class of 2027. Knowing this overall trend, however, doesn’t tell us which states will be in that majority or how much lower scores will go. The table below provides a Most Likely cutoff score, but the more useful information is the Estimated Range. Almost all cutoffs should fall within that range.
State | Class of 2027 (Most Likely) | Class of 2027 (Est. Range) | Class of 2026 (Actual) | Class of 2025 (Actual) | Class of 2024 (Actual) | Avg NMSFs |
|---|---|---|---|---|---|---|
| Alabama | 213 | 210 - 216 | 214 | 212 | 210 | 250 |
| Alaska | 214 | 210 - 216 | 215 | 214 | 209 | 35 |
| Arizona | 218 | 215 - 220 | 218 | 217 | 216 | 398 |
| Arkansas | 213 | 210 - 216 | 215 | 213 | 210 | 143 |
| California | 223 | 220 - 224 | 224 | 221 | 221 | 2,115 |
| Colorado | 218 | 216 - 221 | 219 | 218 | 216 | 286 |
| Connecticut | 222 | 220 - 223 | 223 | 221 | 221 | 175 |
| Delaware | 219 | 218 - 221 | 220 | 219 | 219 | 44 |
| Florida | 217 | 216 - 220 | 219 | 217 | 216 | 999 |
| Georgia | 219 | 217 - 221 | 220 | 218 | 217 | 602 |
| Hawaii | 218 | 215 - 220 | 219 | 217 | 217 | 62 |
| Idaho | 214 | 211 - 217 | 215 | 213 | 211 | 96 |
| Illinois | 220 | 218 - 222 | 222 | 220 | 219 | 704 |
| Indiana | 217 | 214 - 219 | 218 | 217 | 216 | 313 |
| Iowa | 213 | 211 - 216 | 214 | 212 | 210 | 145 |
| Kansas | 216 | 213 - 219 | 216 | 215 | 214 | 144 |
| Kentucky | 214 | 211 - 217 | 214 | 213 | 211 | 201 |
| Louisiana | 215 | 212 - 218 | 216 | 214 | 214 | 222 |
| Maine | 215 | 212 - 217 | 217 | 214 | 213 | 55 |
| Maryland | 223 | 221 - 225 | 224 | 222 | 221 | 308 |
| Massachusetts | 223 | 221 - 225 | 225 | 223 | 222 | 318 |
| Michigan | 219 | 216 - 220 | 220 | 218 | 217 | 485 |
| Minnesota | 218 | 216 - 220 | 219 | 217 | 216 | 279 |
| Mississippi | 213 | 210 - 215 | 213 | 212 | 209 | 155 |
| Missouri | 216 | 213 - 218 | 217 | 215 | 214 | 289 |
| Montana | 211 | 208 - 214 | 213 | 209 | 209 | 47 |
| Nebraska | 213 | 210 - 216 | 214 | 211 | 210 | 105 |
| Nevada | 214 | 211 - 217 | 214 | 214 | 211 | 168 |
| New Hampshire | 217 | 214 - 219 | 219 | 217 | 215 | 60 |
| New Jersey | 223 | 222 - 225 | 225 | 223 | 223 | 451 |
| New Mexico | 211 | 208 - 214 | 210 | 211 | 207 | 104 |
| New York | 221 | 219 - 223 | 223 | 220 | 220 | 1,012 |
| North Carolina | 219 | 216 - 221 | 220 | 218 | 217 | 510 |
| North Dakota | 210 | 207 - 212 | 210 | 210 | 207 | 30 |
| Ohio | 218 | 215 - 220 | 219 | 217 | 216 | 538 |
| Oklahoma | 212 | 208 - 214 | 212 | 211 | 208 | 204 |
| Oregon | 218 | 215 - 220 | 219 | 216 | 216 | 188 |
| Pennsylvania | 220 | 217 - 222 | 221 | 219 | 219 | 596 |
| Rhode Island | 217 | 214 - 220 | 219 | 217 | 215 | 47 |
| South Carolina | 214 | 210 - 217 | 215 | 214 | 209 | 236 |
| South Dakota | 210 | 207 - 213 | 211 | 208 | 209 | 42 |
| Tennessee | 218 | 215 - 219 | 219 | 217 | 217 | 319 |
| Texas | 221 | 218 - 222 | 222 | 219 | 219 | 1,623 |
| Utah | 212 | 210 - 216 | 213 | 211 | 209 | 196 |
| Vermont | 215 | 211 - 217 | 216 | 215 | 212 | 28 |
| Virginia | 222 | 220 - 224 | 224 | 222 | 219 | 437 |
| Washington | 222 | 220 - 224 | 224 | 222 | 220 | 348 |
| West Virginia | 209 | 207 - 212 | 210 | 209 | 207 | 64 |
| Wisconsin | 214 | 213 - 217 | 215 | 214 | 213 | 292 |
| Wyoming | 209 | 207 - 212 | 210 | 209 | 207 | 24 |
| District of Columbia | 223 | 222 - 225 | 225 | 223 | 223 | 36 |
| Territories | 209 | 207 - 211 | 210 | 208 | 207 | 39 |
| Outside US | 223 | 222 - 225 | 225 | 223 | 223 | 86 |
| Commended | 209 | 207 - 210 | 210 | 208 | 207 |
How cutoffs are determined
Qualifying scores (“cutoffs”) are not based on the total score for the PSAT (360-1520) but on the Selection Index, which is calculated by doubling the RW score, adding the Math score, and then dividing the sum by 10. The maximum Selection Index is 228. Students can find a historical set of cutoff data here or see how Semifinalist and Commended counts have changed state by state.
We estimate that the Semifinalist cutoffs will range from 209 to 223. Semifinalists are allocated by state, and cutoffs are calculated by state. If Florida is allocated 1,000 Semifinalists based on its population of high school graduates, then NMSC works down from a perfect 228 Selection Index until it gets as close as possible to that target. Last year, 1,008 students scored at or above the cutoff of 219. A cutoff of 220 would have produced too few Semifinalists. A cutoff of 218 would have gone over the allocation. Because score levels can get crowded, it is easy for cutoffs to move up or down a point even when there is minimal change in testing behavior or performance.
Why does each state have its own Semifinalist cutoff if the program is NATIONAL Merit?
This is always a hot button question. NMSC allocates the approximately 17,000 Semifinalists among states based on the number of high school graduates. That way, students across the nation are represented. It also means that there are very different qualifying standards from state to state. A Massachusetts student with a 220 might miss out on being a Semifinalist. If she lived 10 miles away in New Hampshire, she would qualify.
No Semifinalist cutoff can be lower than the national Commended level. Cutoffs for the District of Columbia and for U.S. students studying abroad are set at the highest state cutoff (typically New Jersey). The cutoff for students in U.S. territories and possessions falls at the Commended level each year. Boarding schools are grouped by region. The cutoff for a given region is the highest state cutoff within the region.
Change is always the theme
Over the last two decades, at least half of the state cutoffs have changed each year. In some years, as many as 49 states saw ups or downs, usually because of questionable test forms. In addition to last year’s exam, the PSATs from 2011 (Class of 2013), 2016 (Class of 2018), and 2019 stand out as problematic. The anomalous 2019 results could be traced back to a particularly mis-scaled form, which I wrote about at the time. The Class of 2014 also saw significant changes, but those were more of a bounce-back from the previous year. The question for the Class of 2027 is how much of a bounce-back will be seen this year.

Cutoffs are particularly bumpy in states with smaller pools of test takers and National Merit Semifinalists. Over the last dozen years, cutoffs in the 12 largest states have remain unchanged 36% of the time, while the cutoffs in the smallest states have remain unchanged only 1 time out of every 5. No large state’s cutoff has jumped by more than 3 points in a year, whereas 6-point changes have occurred in the pool of smaller states.

When are National Merit Semifinalists announced?
The lists of Semifinalists will not be distributed to high schools until the end of August 2026. With the exception of homeschoolers, students do not receive direct notification. NMSC asks that schools not share the results publicly until the end of the press embargo in mid-September, but schools are allowed to notify students privately before that date. NMSC does not send Commended Student letters to high schools until mid-September. Compass will keep students updated on developments as the dates approach.
Do state and national percentiles indicate whether a student will be a National Merit Semifinalist?
No! Approximately 1% of test takers qualify as Semifinalists each year, so it is tempting to view a 99th percentile score as indicating a high enough score — especially now that College Board provides students with percentiles by state. There are any number of flaws that rule out using percentiles as a quick way of determining National Merit status.
- Percentiles are based on section scores or total score, not Selection Index
- Percentiles are rounded. There is a large difference, from a National Merit perspective, between the top 0.51% and the top 1.49%
- Percentiles reveal the percentage of students at or below a certain score, but the “at” part is important when NMSC is determining cutoffs.
- The number of Semifinalists is based on the number of high school graduates in a state, not the number of PSAT takers. Percentiles are based on PSAT takers. States have widely varying participation rates.
- Most definitive of all: Percentiles do not reflect the current year’s scores! They are based on the prior 3 years’ performance. They are set even before the test is given. And if you are going to use prior history, why not use the record of prior National Merit cutoffs rather than the highly suspect percentiles?
Entry requirements for National Merit versus qualifying for National Merit.
Your PSAT/NMSQT score report tells you whether you meet the eligibility requirements for the NMSP. In general, juniors taking the October PSAT are eligible. If you have an asterisk next to your Selection Index, it means that your answers to the entrance questions have made you ineligible. Your answers are conveniently noted on your score report. If you think there is an error, you will also find instructions on how to contact NMSC. Meeting the eligibility requirements simply means that your score will be considered. Approximately 1.4 million students enter the competition each year. Only about 55,000 students will be named as Commended Students, Semifinalists, Finalists, or Scholars. See National Merit Explained for more information.

Art,
Appreciate all you do, and your patience answering what seem like very similar questions. My daughter is in Georgia and received a 219. I’ve been following your article above and see with the newest scores, the projected threshold moved from 218->219. I know your range goes up to 220. How likely is it that we’ll see 220 or higher? Thanks.
Matt,
Yes, once I had the second wave of scores available, it became clear that this year was more likely to be an “up” year than a “down” year. How high is up? I don’t know that on the state level. I still think 219 is the “most likely,” but 220 is a real possibility (Georgia hit it in 3 of the last 9 years, but 2 of those years had more 1400-1520 scorers than we are likely to see this year). 218 also has a shot. So 220 or higher? I think 35-40% is a fair estimate.
Art,
Thank you for the well thought out, and rapid response! Matt
Hello my daughter is in junior year and got perfect psat score of 1520. Will this guarantee semifinalist? She also took SAT and scored 1540. Is that high enough score to become finalist?
Mary,
Congratulations to your daughter on her fabulous scores! Yes, she will be a Semifinalist. And, yes, her 1540 is high enough as a confirming score. She still needs to meet the other requirements to be named a Finalist: recommendation, grades, and essay. But that’s something to think about next September. For now, she has everything she needs.
Hello,
In the state of Minnesota, they haven’t crossed 218 as a cutoff for the past few years. However, with everyone saying scores are going in an upward trend, what is the chance a student gets Semifinalist status as a student in MN with 218 as their NMSC score?
Thanks
Arnav,
You’ve described the dilemma in a nutshell. Recency points to a 218 qualifying. The super-competitive years from 2017-2020 point towards another possibility. Nationally, I don’t think the scores are going to be as extreme as we saw in the classes of 2019/2020, but they are still going to be competitive. I’d put the odds around 50/50. Unfortunately, a 218 is dead center of the “fingers-crossed-until-September” zone.
Hi,
If you had to put a number on your chance of seeing the cutoff for Texas remain at 219 rather than the jump to 220 as you have predicted, what would it be?
Any chance of seeing a 218?
Also how historically accurate have your predictions been?
I’m nervous because I got a 219 in Texas 😅
Thanks!
John
John,
Let me address the accuracy question, because it is an important one. How accurate are my predictions? Not very. And that’s about the best that can be expected. Texas is a great example of what I mean. Realistically, there are 4 potential cutoffs: 218, 219, 220, and 221. We haven’t seen a 218 in more than a dozen years, and the scores this year are strong nationally. So there is a low chance of that happening (we’ll call it 3%). In a normal year, what’s the most common cutoff? The previous year’s cutoff, which occurs about 1/3 of the time (more than that in a large state such as Texas). We’re seeing scores that would have me rank this year as “above normal,” so let’s call the odds of a 219 25%. In the classes of 2018 – 2020, Texas’ cutoff was 221. What did those classes have in common? High numbers of 1400-1520 scorers. But we aren’t likely to see 70,000 of them this year. So I don’t consider 221 my favorite. Let’s call the odds 35%. And we need to reserve a 1% chance of the cutoff going to 222. That would leave 220 at a 41% chance. [And as with any oddsmaker, I consider it within my rights to change my odds at any time!] That would make the 220 “most likely,” and yet it’s going to be right only 2 times out of 5.
The odds of being right in New Jersey are higher. The odds of being right in Alaska are lower.
This is all a long way of saying that I hope my information is hopeful, but I also hope that you make exactly zero life decisions on it. Stay positive, find useful things to do between now and September, and let’s both hope that I am wrong!
Hi Art, Thanks for this amazing resource! Truly enjoyed the article and the clarity with which its written. My son got a 1470 in OR with an index of 218. Your highly likely cutoff for OR is 217 but the range is 215-220. What do you think? Will he make the cutoff for OR?
Harry,
Oregon is one of those no one knows nothin’, sort of states. The only other state that has been as high as 221 and then back down to 216 is Colorado. I could see Oregon at 217 and, unfortunately, I could see it back around 220. Your son’s 218 probably puts his odds at just over 50%.
Hi Art, Thank you for all you do. This is an amazing resource. Could you please expand on your comment that Oregon is a no one knows nothin’ sort of state?
My daughter has a selection index or 220. I know Oregon has reached 220 a couple of times and 221 once in 2019. What’s the likelihood of it going from 216 in 2025 to 221 for 2026? It’s nerve-wracking because Oregon department of Education moved from PSAT to PreACT which will probably skew the SI in unpredictable ways.
Thank you again!
Betty,
I was just referencing how unusual it is for a state that has hit 221 to also hit 216. But your comment forced me to learn somethin’ rather than nothin’.
Thank you for pointing out the DOE change. I had missed that, and it is likely to make a difference. What we normally see in these situations are lower participation rates and lower scores. If I have it right, Oregon pays for all sophomores to test, and it switched in the fall of 2023 to PreACT. That impacts junior-year testing in multiple ways. In many districts, junior PSAT-testing was linked to sophomore testing. Districts either paid for juniors or gave them a subsidized rate. Now, some districts are telling juniors that they are on their own. And finding an out-of-district seat for the PSAT is not easy. The other impact is that the class of 2026, for the most part, didn’t have the practice experience of the sophomore PSAT.
Let’s look at some numbers. I don’t know how many juniors took the PSAT this fall, but it was already on a downward trajectory. I expect it to hit a new low this year. College Board didn’t provide score breakdowns for the class of 2019 — the class that saw the 221 cutoff — but it did for the class of 2020 (a 220 cutoff). There were 15,616 test takers and 4% scored in the 1400-1520 range. By the class of 2024, that had dropped to 11,295 and 3% (I wish those percentages weren’t rounded). Last year, class of 2025, there were only 8,876 juniors with 4% scoring in the top range. Sophomore participation had plummeted to 3,278. So we could very well see half the number of juniors in the class of 2026 as those 15,616 just 6 years ago. It could even drop more than that.
This all makes me skeptical of Oregon seeing a large jump. If I take the other side of the argument, I’d point out that students in NMSF range will try harder than most to take the PSAT. And there is the wildcard of Alternate Entry. I don’t find those arguments that compelling. Based on all of the above, I don’t see Oregon going back to the days of 221 cutoffs. I’m even a bit skeptical of it getting back to 219/220. It sure looks to me like your daughter will be a Semifinalist.
And this is why I love comments. They help me learn new things. Thank you!
So Art are you saying Oregon cutoff for Semifinal might end up being the 216 like the last few years or will it still jump to 217 as you originally expect?
Harry,
All I can say is that the situation is more fluid than I expected. Honestly, had I not known about the recent changes, I probably would have had my “most likely” at 218. It definitely means that a flat cutoff (216) has a better shot than in most states.
Hello. I’m a teacher and tutor in New York State. I have a student that just got a PSAT score of 1500 (740 V, 760 M) with a selection index of 224. I don’t think NY has ever had a selection index above 221. Even with the shift upwards in scoring this year, it’s pretty likely he’ll make the Semifinalist cutoff this year, right? I mean, New York would have to jump five points from its 220 last year to a 225 for him to not make the cutoff. That seems unlikely to me, but what do you think?
Greg,
Yes, it’s well beyond unlikely. There is absolutely no way that New York goes to 225. Your student will be a Semifinalist. Congratulations to him!
Hi I have just gotten a 222 index score – 1490 PSAT in Washington State and this means a lot to me so I was wondering the chances I would qualify for the National Merit Semifinalist as I am really hoping on it not being a 223 after all the work I put in.
Thanks a lot Mr. Sawyer
Sam,
As you probably already know, Washington has never had a 223 cutoff. While the national scores this year look to be higher than they’ve been the last few years, I think the possibility of Washington moving to 223 is very low. I wish I could rule it out entirely, but odd things can happen at the state level, and I don’t want to mislead you. I’d put your chances at 95%.
Hi,
I scrolled through and didn’t see any questions about WV. My son’s selection index is 214. I can see that the cutoff has never been that high in our state, but I was still hoping you could ease a nervous mom’s nerves. I know that scores are looking really good this year!
Thank you! Your knowledge of these statistics is amazing!
Annie,
WV almost always has a Semifinalist cutoff at the Commended level (no state can have a cutoff below the Commended level). We saw the very unusual occurrence last year of the West Virginia cutoff being above the Commended cutoff. But it was 1 point above! I don’t see any reasonable combination of events that would lead to a 215 cutoff. Commended is likely in the vicinity of 210/211. Scores are looking good, but they are still off from the years where we saw a 212 Commended. Even at 2 points above the Commended range, your son qualifies comfortably. He will be named a Semifinalist in September. Congratulations!
My son (a junior) didn’t score high enough to be commended, yet it says he scored high enough to be eligible for the NMS. He is only in the 97th percentile. Am I missing something?
Heather,
If you look at page 2 of your son’s score report, there should be a box labeled Eligibility Information. That presumably says that he meets the entry requirements and will be considered. That same information is on every U.S. junior’s report. It is a confusing way of describing things. College Board doesn’t actually know what the cutoffs will be, so there would be no way for it to indicate a score that is high enough.
Percentiles can be misleading. If his Selection Index is 208 or higher, then I think he at least has a chance of being Commended. It’s more likely, though, that we’ll see a Commended cutoff at 210 or 211.
Hi Art,
Thank you for all you do! How do you feel about a score of 222 in California?
Tina,
I think it has a very high chance of qualifying. Yes, California went as high as 223 in the class of 2023, but that was a more competitive year than even this “up” year. California testing has also declined from its peak. I think we are more likely to see a 221 or 222. I’d put your chances at about 95%.
Why is the ERW score weighted *double* the Math score in the Selection Index? It effectively gives ERW-strong students an advantage over Math-strong students, and I haven’t seen any reasonable explanation for it.
Dave,
I don’t know that there is a reasonable explanation of it, but I know a bit about the history (which is often misinterpreted). The weighting is not new. In fact, I believe it goes back to when the NMSC joined forces with College Board to merger their exams into the PSAT/NMSQT. I don’t have definitive proof of the following, but here is my theory. The original NMSQT had 5 components: English Usage, Mathematics Usage, Social Studies Reading, Natural Sciences Reading, and Word Usage. In other words, it already put a limited weight on math. The PSAT, at the time, had Verbal and Math scores. The verbal exam had antonyms, analogies, sentence completions, and reading passages. So NMSC presumably felt that a doubling of the Verbal score made the most sense in keeping some comparability to the previous exam. In other words, this formulation is more than 50 years old.
It has gone through some changes, though, and that’s where some of the confusion comes in. In the 1990’s College Board was sued by the ACLU and the National Center for Fair Testing because of skewed proportion of male Semifinalists and scholarship winners. Part of the settlement was the inclusion of a Writing section on the PSAT, because female students outperformed males students on that test. The Writing section was essentially derived from the Test of Standard Written English, which had been administered — but scored separately from — the SAT (it had been dropped from the SAT several years earlier and, with some mutations, became the SAT II: Writing test). So now the PSAT diverged a bit from the SAT and had a Verbal, Math, and Writing section. Those three scores were added to get the Selection Index. The the top SI remained at 240. Crucially, though, this change was not the root of the doubling of the verbal scores. That pre-dated the addition of Writing.
This structure eventually became adopted by the SAT, and scores moved from 400-1600 to 600-2400. So during that period, it wasn’t a doubling of the verbal score so much as adding up all of the components of a test that just happened to have a Reading section and a Writing section.
In 2015, though, the PSAT and SAT switched back to a 400-1600 scale and Reading and Writing were partially merged. I say partially, because although they combined to give the PSAT’s 160-760 ERW score, they each had their own 8-38 test scores, as did Math. So the SI at that time added up all of the test scores and doubled them. The top score was now 228. The digital PSAT, introduced last year, has added a new twist. There are no longer separate Reading and Writing sections or scores. NMSC, however, decided to preserve the weighting of the verbal score (after all, it had been doing so for 5 decades).
That is much more than you probably wanted, and also doesn’t fit what you might consider a reasonable explanation. But once I decided to go down the rabbit hole, I decided to go all in.
Thanks for the explanation. I am curious what the male to female distribution of semifinalists has been since the change in scoring following the ACLU settlement. I have not found that information readily available online. I ask because my son’s high school which is newer, has had 5 semifinalists who all advanced to finalist, all female, and 1 commended student, male. since the fist Junior class in 2018. On the face of it, it appears that the formula might have over compensated, but it could just be coincidence. That said, my son did score a 220 index this year ( in NC) so hopefully he will buck the trend.
Linda,
I’m pretty confident that the situation at your son’s school was a coincidence (or just confirmation that it has done a great job at attracting excellent female students). The addition of Writing was not an overcompensation. NMSC avoids breaking down numbers by M/F — lawsuits will do that. I’ve seen some attempts to get at the data via the names of Semifinalists. I’ve tried to avoid going down that pseudo-science rabbit hole. The best confirmation comes from the data that College Board used to release. Back in 2015 (almost two decades after the PSAT change) it released the number of male and female students at every SAT score, and it did so for combined M+R and M+R+W. If we look at the top 16,000 students (that’s not how the state-by-state numbers are calculated, but you get the idea), the split was 61%/39% for Math+Reading and 56%/44% M+R+W.
As for the part that you are probably more interested in (!), I think it is very unlikely that North Carolina will hit a new record this year. I really like his chances at 220.
Thank you for the detailed response! As you said, it’s not what I would consider a reasonable explanation, but it does provide some historical context.
I live in Wisconsin and my Selection Index is 213. Is it very unlikely that I will be a semifinalist?
Julia,
I’d at least remove the “very.” Wisconsin’s cutoff has been at 213 in 3 of the last 5 years. What makes me think it is less likely this year is that we are seeing strong scores nationally, and in that type of year, Wisconsin’s cutoff has gone as high as 217. I think a 214 or 215 is most likely, but I’d put the odds of a 213 at about 20-25%.
Your article and statistics are so fascinating, thanks! How confident do you feel about your Virginia prediction? My child is at the top of your estimated range with a 223, which I am really proud of, but I keep hearing from them that “so many people got really high scores” this year. Maybe this is just because of their school, which is very competitive, but I also see your discussion tha scores are way up overall. I know there is no way of knowing for sure, i am just trying my best to manage expectations in our house!
K,
Every year — even in down ones — I hear the same thing from students about “so many people…”. It’s tough to stay level when it feels like everyone did so well (hint: the students with the highest scores talk and get talked about the most). And lots of students did do well. But it is hardly record numbers. I am just crunching the final wave now, and we’ll end up with about 62,000 scores in the 1400-1520 range. That’s still well below the 2018 – 2020 figures. I don’t think Virginia will even go to 223 (which would be a record). I certainly see no precedent for it going to 224. Maybe it’s not 100% guaranteed, but a 223 feels 99.5%.
And I should have mentioned that your child is among those who did really well!
Thanks, we are very proud! We will keep our fingers crossed that they get good news in the fall.
Ok, Art… after the final wave of scores came in. I see you’re still holding strong to 220 in Texas. Daughter scored a 1480 760Math and 720 Reading. 220 index. Give me your odds on staying at 220 or below. I’m reading that we may not see 2018-2020 index scores so that keeps me hopeful! I read your prior reply about not being very accurate. (Ha!) do you tend to predict lower or higher? Just trying to see our odds here.
Heather,
Yes, I’d say that the last batch of scores was good news. The total numbers of test takers is down from last year and the percentage of high scores was lower in the last batch (as expected, but nice to have confirmed). There is always the danger, of course, of reading too much into the national numbers. The decline may have been focused outside of Texas, for example. I’d peg the chances of a 220 qualifying as 2 out of 3 at this point. 221 is still lurking. If I’m choosing a Most Likely between two well-matched candidates, I’ll usually stick with the one closer to the prior year’s cutoff. I’ve been looking for an excuse to make a Latin pun: Natmerit non facit saltus. Which is kind of true for larger states.
Hello, checking back in again! My daughter got a 212 index score in Oklahoma, and we were wondering about your thoughts on her chances on making it and if your predictions for Oklahoma have been accurate these past couple years.
Layla,
The final batch of numbers confirms that, nationally, it’s a modest up year. I don’t think we’re going to see Oklahoma at 216, for example, but I’m more convinced that we won’t see a lot of state cutoffs dropping either. I still have 212 as my Most Likely, but I’d probably rank it as 50% chance of 212 or lower and 50% chance of 213 or higher. Trying to predict state results can make one look foolish. If we look at the last 3 years, for example, why was Oklahoma at 211 in two of them and 208 in the other? There wasn’t an indication in the national numbers that would indicate that level of change.
What about a 216 in Florida? Is it very unlikely that I will be a semifinalist?
Tina,
The national numbers are showing scores moving up this year. For a 216 to qualify, Florida would need to move against the tide. Much stranger things have happened. I’d put the chances at about 10-15%.
Hi,
My daughter and I are in Texas and she got a 220 index score. She is aiming to become a National Merit Finalist but she is worried that her score isn’t high enough to get semi-finalist. Now that all the scores have released, what would you say her odds are to become a semi-finalist? Thanks.
Marie,
I think the chances of a 220 qualify are about 2 out of 3. I still don’t think we can rule out a 221. I’m afraid that that may not be the level of reassurance that your daughter would like, but she is still in an excellent position to become a Semifinalist.
Thank you so much for replying! Just wondering, would you say the final wave was for the better or worse?
Anything that kept us away from the extremes was better. The final wave did just that.
Thank you so much for your help! My daughter is still a little worried but knowing she still has a fighting chance helped her calm down a little. One last question, will there be any more updates in the predictions or is it just a waiting game now? Thanks again!
Marie,
In April or May we should get leaked word of the Commended level. In theory, that could spark some revisions. In practice, they will likely be minimal, since I doubt that we are in for much of a surprise. For the most part, it’s all about waiting.
Hi,
When you say the number of scores ranging in the 1400-1520 range is high, do you know how many are in the 1400-1449 range vs. 1450-1520? Wouldn’t having more students score in the higher range impact state cutoff scores? Conversely, if a lot of the scores are in the low 1400’s, wouldn’t that make a difference in cutoff scores as well?
Cheryl,
There was nothing in the last set of scores that made me reevaluate my estimates for New York. I still think 220 is the most likely cutoff, and I still believe that we cannot rule out 219 or 221.
College Board doesn’t release any data beyond the 1400-1520 set. You may be referencing my post where I was describing the general distribution of scores. There are always going to be more modestly high scores than very high scores — it’s just the way the distribution falls. I don’t have any insight into changes for this year in those figures.
Hi,
We live in Ohio. My son is in his Junior year and got a 214 index score on PSAT. Is there any chance of getting into the Semifinalists category for 2026?
Thanks.
DeepaRajan,
I think it is likely that your son will be named a Commended Student. While there may be some Semifinalist cutoffs that decline this year, I doubt that we will see any new record lows. Ohio’s cutoff has ranged between 215 and 219 over the last decade.
Hi Art, After the final wave, I see you bumped Florida to 220 for the upper limit. What do you think the chances are that it will, as predicted, be 218 (my daughter’s score)? Also, if she is borderline, is there any way to determine this definitively before next August/September? Thank you!!
CMM,
The easy part first: short of Wikileaks suddenly taking interest in National Merit scores, there is no way to determine anything definitively before next Aug/Sept. The only thing that we are likely to know in April or May is the Commended level. That won’t give us enough information to say anything about Florida.
In doing my final pass, I took a hard look at my ranges. Essentially, I asked myself, “If you think the Most Likely is 218, do you feel comfortable saying that the cutoff can not reach 220?” I decided that I wasn’t comfortable. I wouldn’t read too much into that. I’d peg 218 or lower as 70% likely. I wouldn’t argue with someone who said that it is even more likely.
I see you bumped up the Mississippi range to include 215 and the most likely to 213. My daughter has a 214 which makes me nervous. Can you give me a % chance she qualifies? Looking through your historical data I never saw a year Mississippi jumped more than 2 points so hopefully that holds true this year as well. Thanks for all you do.
Hector,
While I felt like I couldn’t exclude 215 in my estimated range, I didn’t really change my take on Mississippi. 213 remains my most likely and I’d even say that 212 is more likely than 214. When looking at score changes, I think about drops as well as increases, since either direction indicates variability. MS has twice seen drops of 3 points. This is to be expected. Because of a relatively low PSAT participation rate, MS is one of the smallest states in terms of NMSP entrants. I think a 214 is in the 90-95% range.
Thanks for pulling all of this information together. It’s so helpful! My son is in PA and is right at the projected cutoff of 219. I know you are projecting an overall increase in state cutoffs, but kept PA at 219 (same as the past two years). How confident are you in the 219 and should he be worried about it going up to 220 this year. Thanks again!!
Greg,
I like to point out to students that it is much more productive to worry about things that you can control. Is you homework done? Are your gutters clean? Are you ready for the SAT? I think the same thing applies to parents (especially that second one). There is really little information that lets us distinguish between a 219 or 220. I parse things a number of different ways, and I never alighted on one that made me think 220 was the *most* likely result. For example. when I looked at PA’s cutoff over the years where the Commended level fell between 208 and 212, the average was 218.8. We’ve seen PA’s cutoff at 220, but it was in years where we saw far more upward pressure on cutoffs across the country. I’m optimistic about a 219, I just don’t think we can say it is a guarantee. 80%?
Hi Art, Thanks so much for all this information! It’s been so great and also the quick updates after the scores are announced are amazing. I see you moved Florida from 216-219, to 216-220. My daughter has a 218 so I guess we’ll just have to wait and see what happens. Florida has hovered around 216/217 it looks like and was 217 last year. Have you seen 2 point jumps very often? Wondering why you increased the upper end from 219 to 220 based on this last batch of scores. Thanks so much!!!
Jessica,
For part of my reply, I’m going to quote myself from another comment I made after you submitted your question: “In doing my final pass, I took a hard look at my ranges. Essentially, I asked myself, “If you think the Most Likely is 218, do you feel comfortable saying that the cutoff can not reach 220?” I decided that I wasn’t comfortable. I wouldn’t read too much into that. I’d peg 218 or lower as 70% likely. I wouldn’t argue with someone who said that it is even more likely.”
As for 2 point jumps: In large states such as Florida, they are not common, but they do happen. I’ve tried to factor that into my odds. Best of luck to your daughter!
Hello Art,
With the last wave of scores have released, any chance NJ would increase to 224? Reading the comments about this state would be the one to go up a point makes me a bit nervous. My daughter got 1490, which gave her a 223 SI… thanks for your time.
Tricia,
There was certainly nothing that made me feel that a 224 had become more likely, but we can’t completely rule it out. Here is a mantra: “It’s never happened before. It’s never happened before. It’s…” Positive thoughts!
Is there any chance that Missouri’s cutoff goes down to 213 this year? It’s so hard to be so close!
Jade,
It is hard, and you’ll need to wait until September to know for sure. My feeling is that Missouri is likely to come in at 214 or higher, but I can point to the 213 in the class of 2023 and send you some positive vibes!