**This post is an archive for the class of 2021. Please see Compass’s National Merit Semifinalist post for current information.**
August 23 Update: CUTOFFS ARE OFFICIAL
The Semifinalist cutoffs for the class of 2021 (October 2019 PSAT) have leaked early this year [thank you to those who alerted me to it]. They reflect the largest decline we have ever seen — a result of College Board’s inability to maintain consistent difficulty and scaling across multiple test forms. All 50 states have lower cutoffs for the class of 2021 compared to the class of 2020. As we learned in April, the Commended cutoff fell from 212 to 209. What is somewhat surprising is how sharp the difference is between the highest scoring states and everyone else. Of the 10 states at a cutoff of 221 or higher for the class of 2020, 8 saw only a 1-point decline. Illinois and Texas were the exceptions, with 2-point declines. The average decline among the other 40 states was 2.7 points. This implies that PSAT scaling was more problematic in the 700 range than it was at the very top of the scale, which is somewhat surprising. Students in the class of 2022 can find information and speculation about the October 2020 PSAT here.
Students may not receive notice of their Semifinalist status until mid-September. Notifications were mailed to schools on August 25th. NMSC asks schools not to make the names public until the press release date (usually the second week in September). Many schools interpret this to mean that they are allowed to notify students privately prior to the release; other schools prefer to wait until names are released to the media (September 9th, 2020). NMSC will not confirm a student’s status until the press release date. Finalist applications are not due until October 7th.
Due to the pandemic, ACT and SAT scores will not be required or considered for Finalist standing. NMSC has posted the 2021 Requirements and Instructions for Semifinalists.
| State | Class of 2021 (Actual) | Change | Class of 2020 (Actual) | Class of 2019 (Actual) | Class of 2021 Semifinalists | Class of 2021 Commended |
|---|---|---|---|---|---|---|
| Alabama | 212 | -4 | 216 | 216 | 227 | 120 |
| Alaska | 212 | -1 | 213 | 215 | 36 | 11 |
| Arizona | 218 | -1 | 219 | 220 | 295 | 511 |
| Arkansas | 212 | -2 | 214 | 214 | 140 | 63 |
| California | 221 | -1 | 222 | 223 | 1942 | 7235 |
| Colorado | 217 | -3 | 220 | 221 | 270 | 399 |
| Connecticut | 220 | -1 | 221 | 222 | 194 | 644 |
| Delaware | 219 | -1 | 220 | 222 | 45 | 105 |
| District of Columbia | 222 | -1 | 223 | 223 | 28 | 184 |
| Florida | 216 | -3 | 219 | 219 | 879 | 1242 |
| Georgia | 219 | -1 | 220 | 220 | 456 | 1021 |
| Hawaii | 217 | -2 | 219 | 220 | 63 | 119 |
| Idaho | 214 | -1 | 215 | 214 | 78 | 77 |
| Illinois | 219 | -2 | 221 | 221 | 694 | 1735 |
| Indiana | 215 | -3 | 218 | 219 | 340 | 406 |
| Iowa | 212 | -3 | 215 | 216 | 162 | 73 |
| Kansas | 214 | -4 | 218 | 218 | 143 | 134 |
| Kentucky | 214 | -3 | 217 | 218 | 205 | 165 |
| Louisiana | 212 | -3 | 215 | 217 | 233 | 113 |
| Maine | 213 | -2 | 215 | 217 | 72 | 48 |
| Maryland | 221 | -1 | 222 | 223 | 296 | 1057 |
| Massachusetts | 222 | -1 | 223 | 223 | 341 | 1579 |
| Michigan | 216 | -3 | 219 | 219 | 542 | 723 |
| Minnesota | 218 | -1 | 219 | 220 | 288 | 549 |
| Mississippi | 211 | -3 | 214 | 215 | 141 | 29 |
| Missouri | 214 | -3 | 217 | 217 | 332 | 289 |
| Montana | 210 | -4 | 214 | 214 | 47 | 10 |
| Nebraska | 213 | -3 | 216 | 216 | 103 | 58 |
| Nevada | 215 | -3 | 218 | 218 | 112 | 100 |
| New Hampshire | 215 | -3 | 218 | 219 | 72 | 103 |
| New Jersey | 222 | -1 | 223 | 223 | 594 | 2560 |
| New Mexico | 211 | -2 | 213 | 215 | 102 | 25 |
| New York | 220 | -1 | 221 | 221 | 1035 | 2880 |
| North Carolina | 217 | -2 | 219 | 220 | 494 | 882 |
| North Dakota | 209 | -3 | 212 | 212 | 28 | 0 |
| Ohio | 215 | -3 | 218 | 219 | 681 | 748 |
| Oklahoma | 211 | -3 | 214 | 215 | 180 | 39 |
| Oregon | 217 | -3 | 220 | 221 | 182 | 298 |
| Pennsylvania | 217 | -3 | 220 | 220 | 721 | 1165 |
| Rhode Island | 216 | -2 | 218 | 220 | 50 | 58 |
| South Carolina | 212 | -3 | 215 | 216 | 197 | 103 |
| South Dakota | 209 | -5 | 214 | 215 | 36 | 0 |
| Tennessee | 215 | -4 | 219 | 219 | 332 | 352 |
| Texas | 219 | -2 | 221 | 221 | 1441 | 3448 |
| Utah | 212 | -3 | 215 | 215 | 157 | 86 |
| Vermont | 212 | -4 | 216 | 216 | 33 | 17 |
| Virginia | 221 | -1 | 222 | 222 | 369 | 1612 |
| Washington | 220 | -1 | 221 | 222 | 343 | 1030 |
| West Virginia | 209 | -3 | 212 | 212 | 62 | 0 |
| Wisconsin | 213 | -3 | 216 | 216 | 314 | 214 |
| Wyoming | 209 | -3 | 212 | 212 | 16 | 0 |
| U.S. Abroad | 222 | -1 | 223 | 223 | 103 | 528 |
| U.S. Territories | 209 | -3 | 212 | 212 | 27 | 0 |
| U.S. Boarding Schools | * | * | * | * | 180 | 666 |
| Commended | 209 | -3 | 212 | 212 |
Eligible students receiving a Selection Index at or above the cutoff for their state are named Semifinalists and can apply to be Finalists. Students scoring at or above 209, but less than their state’s cutoff, are named Commended Students. Boarding school cutoffs are set regionally at the highest state cutoff within a region.
An Unprecedented Change
Earning a score high enough to be named a National Merit Semifinalist is not an easy feat — only about 1% of test takers achieve it. Producing a test and a scale that can distinguish among such high-scoring students is also not an easy feat. Changes within individual states can be caused by shifts in demographics or participation or chance. When large-scale shifts occur, though, it is almost always attributable to imprecise test construction. A single wrong answer on the October 2019 PSAT could have lowered a student’s Selection Index by as many as 4 points or as few as 1 point depending in which section the error occurred and which test form the student took.
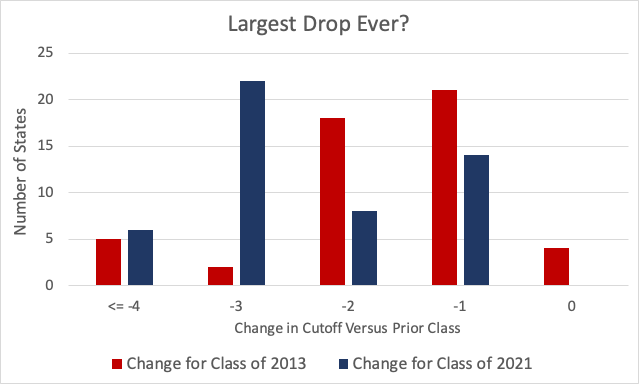
This year 28 states saw a decline of 3 or more points in their Semifinalist cutoffs. In the next most volatile year in recent memory (2013), only seven states saw a change of that magnitude. The average decline this year was almost a full point more than the previous record holder.
A Bounce-back for the Class of 2022?
Because large swings are due to unusual test forms, an up or down year is often followed by a settling back to the overall trend. We would normally expect to see the same thing occur with the October 2020 PSAT. However, we’ve never seen a PSAT during a pandemic before. And many schools won’t see a PSAT at all. We’ve created a short (and speculative) post to discuss what might happen with National Merit for the class of 2022. You can also see a complete history of Semifinalist cutoffs for the last 13 years.
Confirming Scores and Finalist Status
Given the cancellations of the SAT and ACT, many class of 2021 Semifinalists are concerned about earning the confirming score required to move from Semifinalist to Finalist. Class of 2021 Semifinalists would normally need to earn a high enough score on the SAT (or a concordant score on the ACT) between August 2018 and December 2020. NMSC has not yet announced any changes to its plans or timeline. Semifinalists do not receive access to the online application portal until mid-September. We may know more at that time. For more information about the Finalist stage, please see our National Merit FAQ.
The commentary below was published prior to the release of the official cutoffs.
The Decline in High Scores
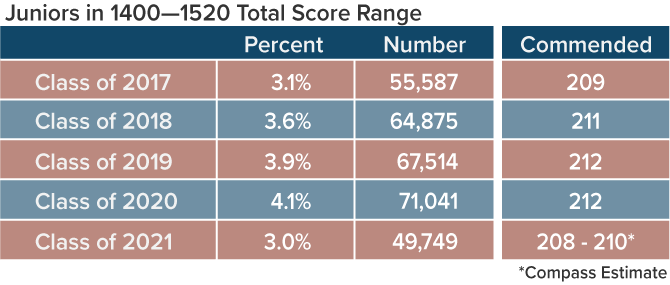
A key statistic we look at is the number of students scoring at or above 1400 in Total Score. College Board does not report more granular data or information on Selection Index distribution. But the 1400+ figure is a useful indicator of where the Commended Student cutoff will fall. [Commended is now confirmed at 209, and all Semifinalist cutoffs are in the table at the top of the page.]
 Large changes have happened in the past. The jump in 1400+ scorers from the class of 2017 to the class of 2018 was, at least, predictable. The class of 2017 had to contend with the rollout of the new PSAT and a questionable exam. For the class of 2018, the Commended cutoff went up two points, and only Rhode Island saw a lower cutoff.
In the years since, there have been increasing numbers of students achieving 1400+ scores, and Commended cutoffs have inched upward. Things reversed course dramatically on the 2019 PSAT. The class of 2021 has 49,749 students in the 1400–1520 range (as reported in mid-Dec by College Board)—even fewer than the 55,587 in the class of 2017. As we expected, this led to a 209 Commended cutoff.
What evidence is there of the relationship between national and state changes?
The drop in the Commended cutoff does not mean that state cutoffs will all move in lockstep. I expect most states to see declines of between 1 and 4 points. It’s possible that some states will see no change, which is why last year’s cutoff is the upper bound of most of our estimated ranges.
The table below summarizes 12 years of Semifinalist cutoff changes. It shows how cutoffs at the state level have corresponded with the national Commended cutoff. For example, there was 1 year in which the Commended cutoff declined by 2 points. In that year, 17 states had cutoffs that were unchanged. Only 1 state saw a higher cutoff.
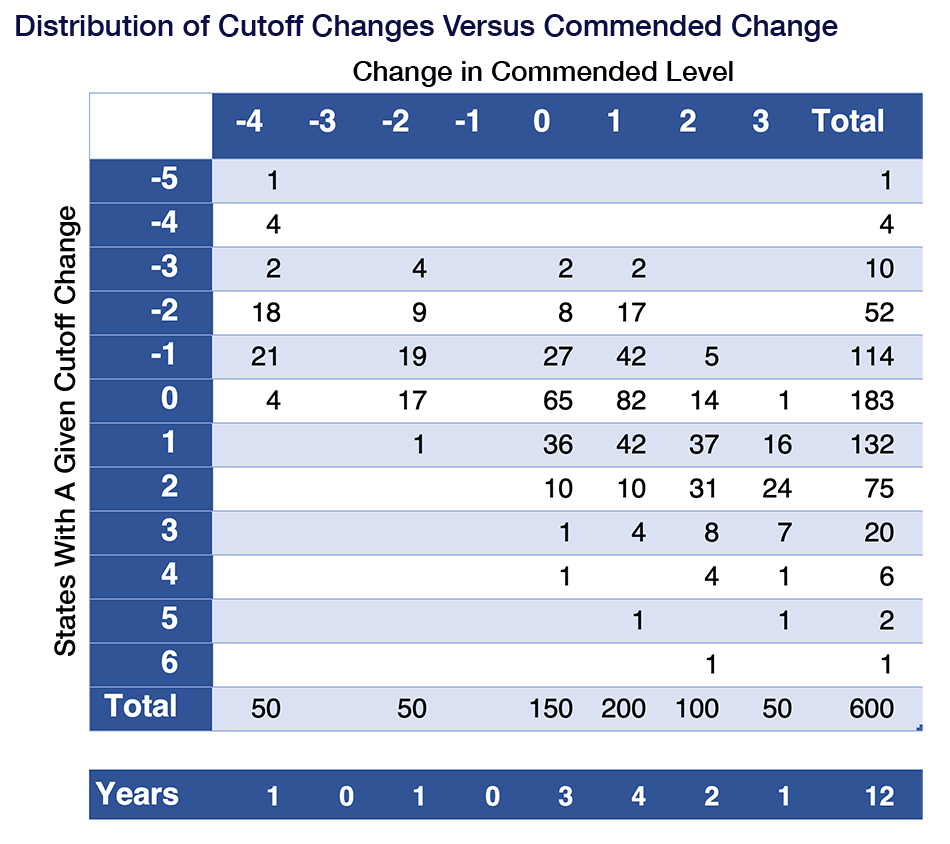
The table gives insight into what might happen when nationwide scores decline. In the 6 years in which the Commended level changed by 2 or more points—up or down—there are 300 data points from the 50 states. Only 6 cutoffs (2%) moved in the opposite direction of the Commended change. These 6 have all been states with a low number of Semifinalists. I don’t expect any large state to see an increase this year. I expect the vast majority to see lower cutoffs.
Update: Now that we know the Commended cutoff fell 3 points, I am more convinced than ever that few, if any, states will see an upward movement. It is likely, in fact, that 40-45 states will have lower cutoffs this year.
We have also analyzed a sample of anonymized 2018 and 2019 PSAT data from high schools. The school data gives us insight to the very top of the range (220+). The data confirm our hypothesis that even the highest-scoring states will see declines. The dataset is not diverse enough for us to use it to predict specific cutoffs.
Below are excerpts from our original post, with annotations where our new knowledge has reshaped our conclusions.
Why do we emphasize ranges?
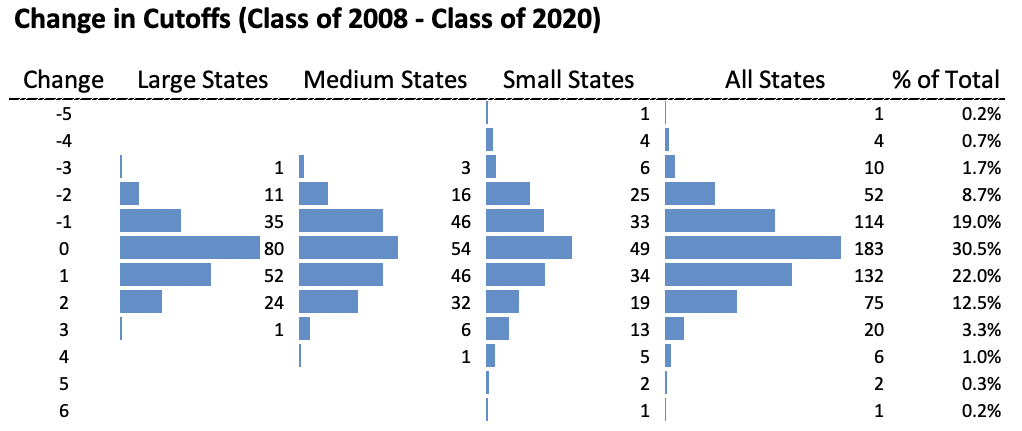
The only predictable thing is unpredictability. Over the last 12 years, cutoff changes have shown a roughly normal distribution. The catch is that there is no way of predicting where on the curve an individual state will fall. Compass has also found that there is a wider spread of cutoff changes in smaller states (defined as the 16 states with the lowest number of Semifinalists).
The chart demonstrates two things. First, we can’t be assured that any estimate of a cutoff will be correct. There are always changes in the mix. Second, the best estimate is “no change.” [We now have firm reason to believe that cutoffs will decline this year, so the Most Likely figures have been adjusted downward. –ed.]
On average, about 60% of cutoffs hold fast or go down. A given year, though, is rarely average. Below is a chart showing the number of state cutoffs that have gone up, remain unchanged, or gone down in each year. [We now believe that the changes for the class of 2013 will look something like those we saw for the class of 2013. –ed.]
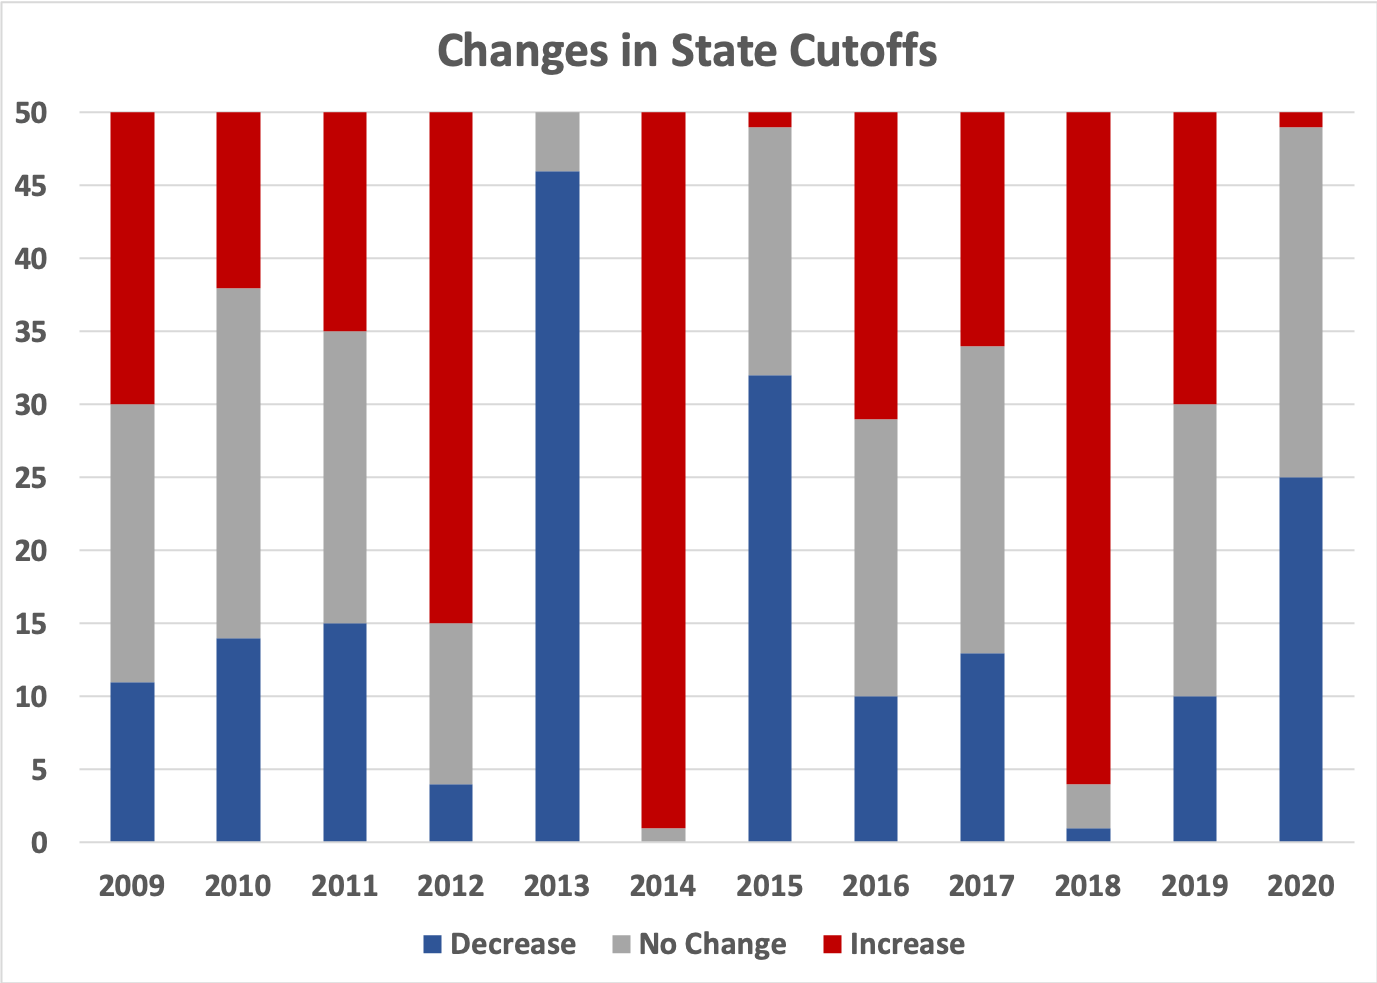
The class of 2018 saw increases in 46 states; the class of 2020 saw an increase in 1 state! Which kind of year do we expect for the class of 2021? [We now know exactly what kind of year it was, with all 50 states showing lower cutoffs.]
Everything we think percentiles tell us about National Merit is wrong.
College Board’s percentile reporting falls somewhere between misleading and wrong. First, the percentiles prominent on students’ PSAT reports are for a “Nationally Representative Sample.” The sample reflects the hypothetical results if every student in a class year took the PSAT. The College Board also reports the PSAT/NMSQT User percentiles (found only on a student’s online report or in Understanding the PSAT/NMSQT) based on students who have actually taken the PSAT. These figures are lower than the Nationally Representative figures, since the PSAT-taking group has a higher proportion of college-bound students. However, the User percentiles are for the class years of 2018, 2019, and 2020 and not for the class of 2021. The percentiles reported by College Board do not reflect the results of a single student who took the October 2019 PSATs. We could also quibble about the fact that percentiles are rounded or that not all test-takers are eligible for National Merit or that no percentiles are provided for the Selection Index, but the fact that percentiles are not shaped in any way by student results from this year’s PSATs immediately disqualifies them from consideration.
Will the harsh scales alter the Semifinalist cutoffs?
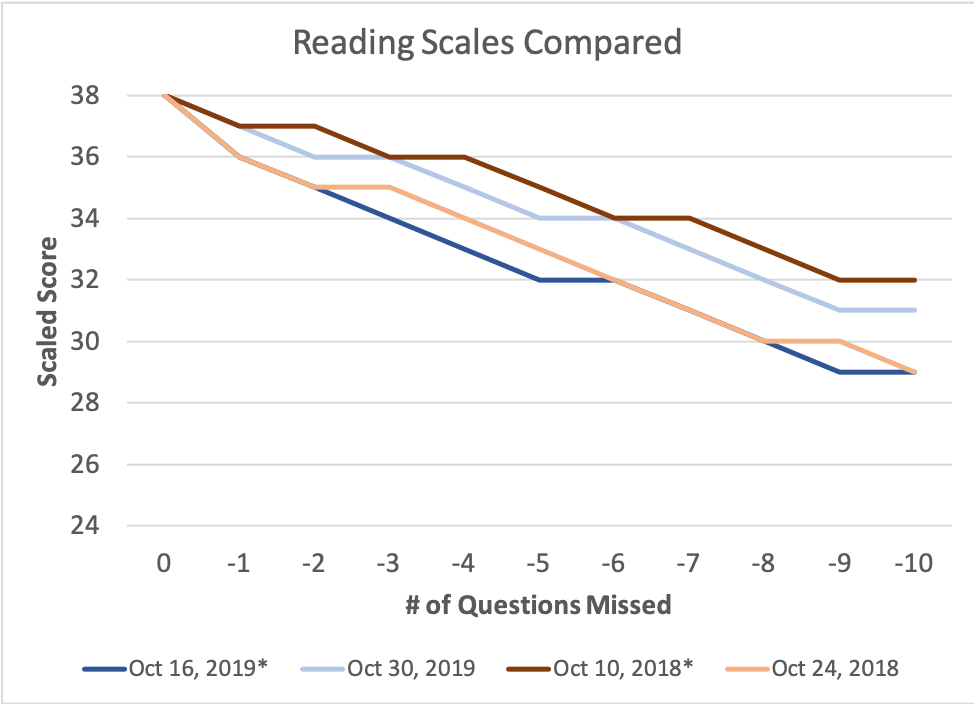
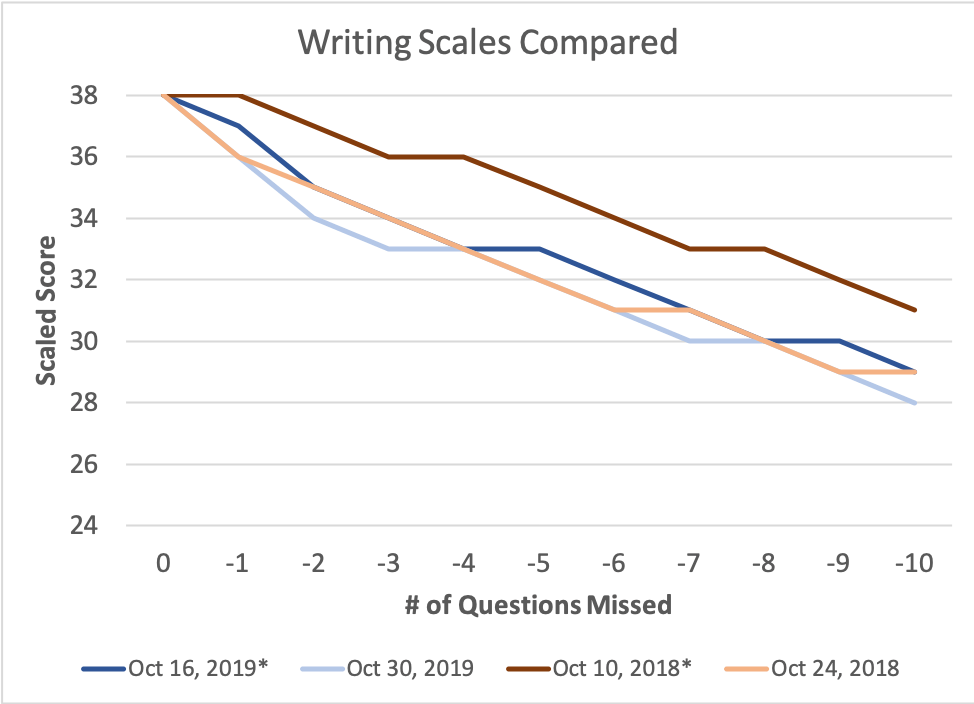
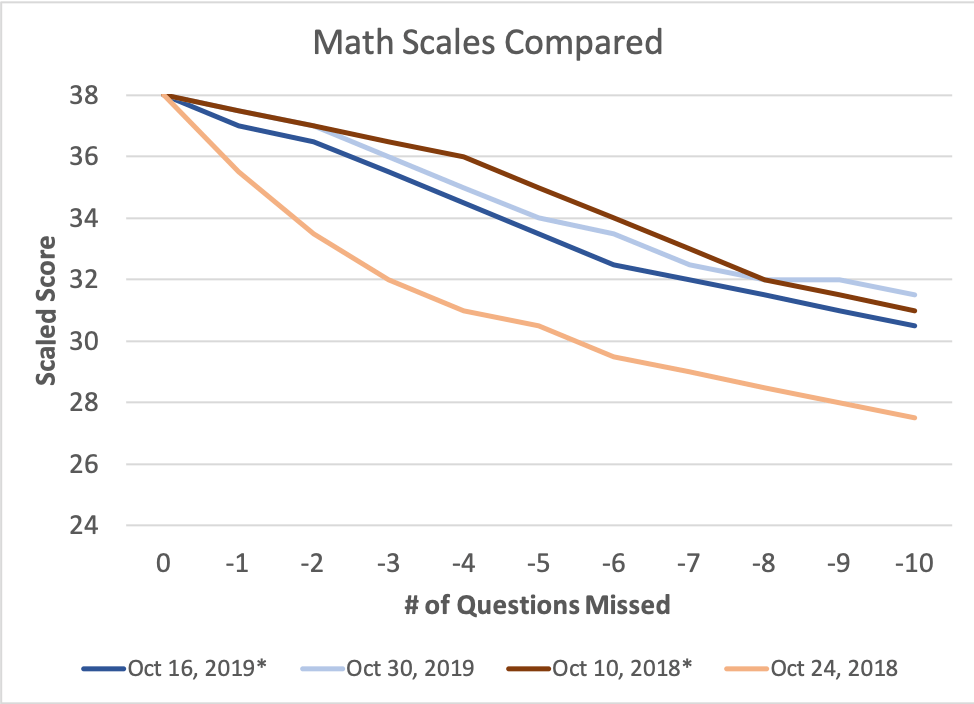
Students missing a single question have always scored high enough to be Semifinalists, and that will be true again this year. On some test forms, just two missed questions has been able to take a student below the cutoff in the most competitive states. The table below shows the impact of two incorrect answers on a student’s Selection Index for the 2018 and 2019 PSATs. The PSAT is given on a primary date and an alternate date each year. Anywhere from 80–90% of students test on the primary Wednesday date.
Comparing the impact of incorrect answers on Selection Index across test forms
Reading | Writing | Math | Oct 16, 2019 (Primary) | Oct 30, 2019 (Alternate) | Oct 10, 2018 (Primary) | Oct 24, 2018 (Alternate) |
||
|---|---|---|---|---|---|---|---|---|
| -1 | 0 | -1 | 222 | 225 | 225 | 219 | ||
| 0 | -1 | -1 | 224 | 223 | 227 | 219 | ||
| -1 | -1 | 0 | 222 | 222 | 226 | 220 | ||
| -2 | 0 | 0 | 222 | 224 | 226 | 222 | ||
| 0 | -2 | 0 | 222 | 220 | 226 | 222 | ||
| 0 | 0 | -2 | 225 | 226 | 226 | 219 |
In college admission, the difference on the SAT between a 730 ERW and a 740 ERW is trivial. On the all-or-nothing PSAT/NMSQT, however, small changes can prove significant. The Semifinalist cutoff for New Jersey was 223 last year. Even with a perfect Math score, a student would have still needed an ERW score of 740 or better to be named a Semifinalist. The ERW score receives twice the weight of the Math score, so errors can prove costly.
Why do test scales vary?
In theory, a more challenging scale exists only to offset an easier test. The scaling done on the PSAT is different from what a classroom teacher might do to determine that a certain percentage of students will receive As, a certain percentage will receive Bs, and so on. PSAT scaling is designed to take into account the small differences in difficulty between test forms. In recent years, however, we have seen large swings in test difficulty on both the SAT and PSAT. Last year’s alternate date PSAT saw an historically easy Math section and correspondingly harsh scale. While this year’s scales aren’t quite as bad as the October 24, 2018 scale, they are steeper than usual. The steep drop—particularly at the high end of the scale and particularly on the ERW—may end up lowering cutoffs for the class of 2021. As more data becomes available, we expect to better test this thesis. The impact is more likely to be seen on the highest cutoffs. By the time scores reach the expected Commended range, scale fluctuations tend to be less important.
 Have things always been this bad?
No. Two trends have created the knife’s edge we saw last year and expect to see again this year. Elite students are stronger testers than they were a decade ago, and changes to the PSAT have made the test easier. On the 2008 PSAT, a California Semifinalist could have missed 8 or 9 questions. On the October 24, 2018 PSAT, a student would have needed to miss no more than a single question. We don’t yet know, of course, how students will fare this year.
Why do states have such different cutoffs?
Cutoffs vary across the country because the 16,000 Semifinalists are allocated proportionally to states based on the total number of graduating seniors in each state. A state’s cutoff is derived by finding the score that will produce, as closely as possible, the targeted number of Semifinalists. Students in any given state are competing only against fellow residents. The test is national; the competition is local. Boarding school students are a special case and must meet the highest state cutoff in their region.
What about the Commended cutoff?
The Commended student cutoff is set nationally, so it is the same for all participants.
Where can I learn more?
We regularly update this page and try to answer all questions in the comments. Our National Merit FAQ has the most detailed explanations on the steps in the National Merit Scholarship Program.
