
[This page is a summary of the final cutoffs for the class of 2023. For information about the current class, please see our latest National Merit post.]
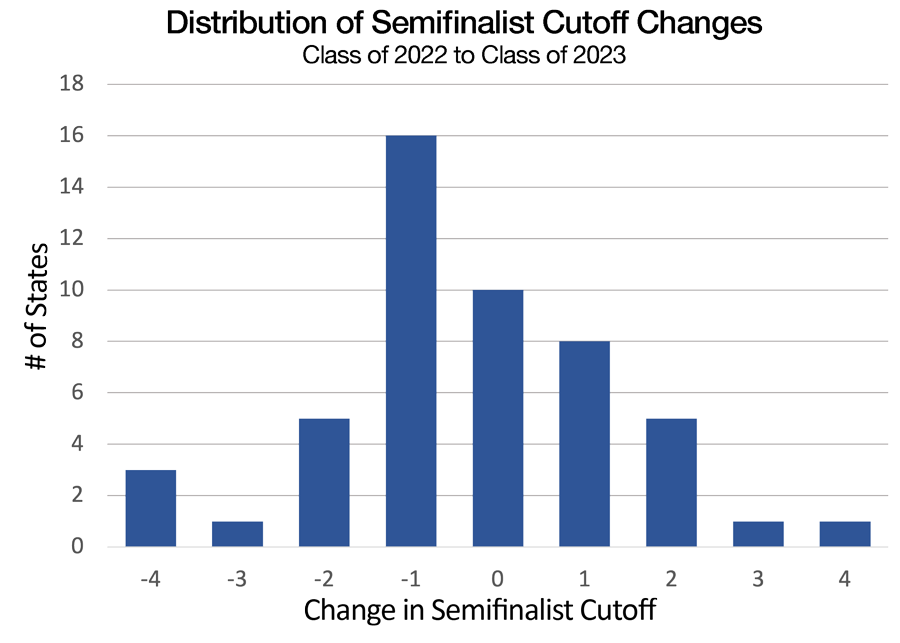
The National Merit Semifinalist and Commended cutoffs for the class of 2023 are provided below. Despite the Commended cutoff remaining at 207, only 10 states saw unchanged Semifinalist cutoffs. At the extremes, Arizona, Nevada, and Oregon all saw 4-point declines in their cutoffs, while Maine had a 4-point increase. See the distribution of changes in the chart below. [For a general overview of the National Merit process, including Finalist selection and confirming scores, see our FAQ. For a look at cutoff trends going back to the class of 2008, see Historical National Merit Cutoffs.]
Among smaller states (the 25 states with the fewest Semifinalists), only Kentucky’s and West Virginia’s cutoffs remained unchanged from last year. Large states were not immune to changes, either. California’s cutoff declined to 220, a mark it hadn’t seen in a decade. The next three largest states — Texas, New York, and Florida — also saw single-point declines in their Semifinalist cutoffs.
New Jersey set the standard this year with a 223 cutoff. The cutoffs for the District of Columbia and U.S. Students Studying Abroad are set at the highest state mark, so they are also at 223. All of the figures below are confirmed and final.
| State | Class of 2023 (Actual) | Change | Class of 2022 (Actual) | Class of 2021 (Actual) | Class of 2020 (Actual) |
|---|---|---|---|---|---|
| Alabama | 212 | 0 | 212 | 212 | 216 |
| Alaska | 210 | 2 | 208 | 212 | 213 |
| Arizona | 214 | -4 | 218 | 218 | 219 |
| Arkansas | 210 | -1 | 211 | 212 | 214 |
| California | 220 | -1 | 221 | 221 | 222 |
| Colorado | 217 | 0 | 217 | 217 | 220 |
| Connecticut | 221 | 1 | 220 | 220 | 221 |
| Delaware | 218 | -2 | 220 | 219 | 220 |
| District of Columbia | 223 | -1 | 224 | 222 | 223 |
| Florida | 216 | -1 | 217 | 216 | 219 |
| Georgia | 218 | -1 | 219 | 219 | 220 |
| Hawaii | 215 | -2 | 217 | 217 | 219 |
| Idaho | 215 | 1 | 214 | 214 | 215 |
| Illinois | 219 | 1 | 218 | 219 | 221 |
| Indiana | 214 | -1 | 215 | 215 | 218 |
| Iowa | 212 | 1 | 211 | 212 | 215 |
| Kansas | 214 | -1 | 215 | 214 | 218 |
| Kentucky | 212 | 0 | 212 | 214 | 217 |
| Louisiana | 213 | 0 | 213 | 212 | 215 |
| Maine | 215 | 4 | 211 | 213 | 215 |
| Maryland | 222 | -2 | 224 | 221 | 222 |
| Massachusetts | 220 | -1 | 221 | 222 | 223 |
| Michigan | 218 | 1 | 217 | 216 | 219 |
| Minnesota | 216 | -2 | 218 | 218 | 219 |
| Mississippi | 210 | -3 | 213 | 211 | 214 |
| Missouri | 213 | -1 | 214 | 214 | 217 |
| Montana | 207 | -1 | 208 | 210 | 214 |
| Nebraska | 212 | 2 | 210 | 213 | 216 |
| Nevada | 210 | -4 | 214 | 215 | 218 |
| New Hampshire | 213 | -1 | 214 | 215 | 218 |
| New Jersey | 223 | 1 | 222 | 222 | 223 |
| New Mexico | 208 | -2 | 210 | 211 | 213 |
| New York | 219 | -1 | 220 | 220 | 221 |
| North Carolina | 217 | -1 | 218 | 217 | 219 |
| North Dakota | 209 | 2 | 207 | 209 | 212 |
| Ohio | 216 | 1 | 215 | 215 | 218 |
| Oklahoma | 211 | 1 | 210 | 211 | 214 |
| Oregon | 216 | -4 | 220 | 217 | 220 |
| Pennsylvania | 218 | 0 | 218 | 217 | 220 |
| Rhode Island | 216 | 3 | 213 | 216 | 218 |
| South Carolina | 213 | 0 | 213 | 212 | 215 |
| South Dakota | 212 | 2 | 210 | 209 | 214 |
| Tennessee | 215 | 0 | 215 | 215 | 219 |
| Texas | 219 | -1 | 220 | 219 | 221 |
| Utah | 211 | -1 | 212 | 212 | 215 |
| Vermont | 213 | 2 | 211 | 212 | 216 |
| Virginia | 221 | 0 | 221 | 221 | 222 |
| Washington | 220 | 0 | 220 | 220 | 221 |
| West Virginia | 207 | 0 | 207 | 209 | 212 |
| Wisconsin | 213 | -1 | 214 | 213 | 216 |
| Wyoming | 207 | -1 | 208 | 209 | 212 |
| U.S. Territories | 207 | 0 | 207 | 209 | 212 |
| Studying Abroad | 223 | -1 | 224 | 222 | 223 |
| Commended | 207 | 0 | 207 | 209 | 212 |
Four factors mixed together this year to produce a wide distribution of score changes:
- Test Difficulty
- Participation Rates
- Alternate Entry
- Learning Gaps
Test Difficulty. The number of test-takers went up 50%, but cutoffs declined slightly this year. That’s often an indication of an exam that was scaled more difficultly at the top end of the range. One problem with this theory is that New Jersey was still able to reach 223. However, given that only Maryland reached 222 and that several high-scoring states saw declines, we can’t discount this explanation.
Participation Rates. The number of Semifinalists awarded in a state remains approximately the same no matter how many students take the PSAT. If participation is low, the cutoff skews lower. In the case of California, for example, the total Commended numbers — which tend to float with participation — indicate that testing has still not bounced back completely from the wide-scale cancelations of 2020.
Alternate Entry. The class of 2022 numbers had extremely unusual Alternate Entry rates. Students who miss the PSAT can enter via SAT scores. Because of how the SAT is scored and when it can be taken and re-taken, these Alternate Entry students often see higher scores than those taking the PSAT. That’s why Maryland jumped to 224 last year. Virtually the entire public-school system missed the PSAT. It was not surprising to see some of the Alternate Entry-inflated numbers settling back down.
Learning Gaps. Finally, learning gaps from remote learning and school disruptions have had a measurable impact on the test performance of students of all ages. The weak National Merit numbers may indicate that performance deficits even impacted top test-takers.
Looking ahead to the class of 2024
The over-representation of large states in the set of states with stable or declining cutoffs means that 82% of Semifinalists this year could have achieved Semifinalist status by reaching the class of 2022 levels. Counting on that happening again is a poor assumption for the class of 2024. In a more typical year, it is true of only 60% of Semifinalists. In a “bounce-back” year, it can be true of as few as 5% of students. Class of 2024 students hoping to make Semifinalist should look to outperform the class of 2023 by 1 to 2 points.
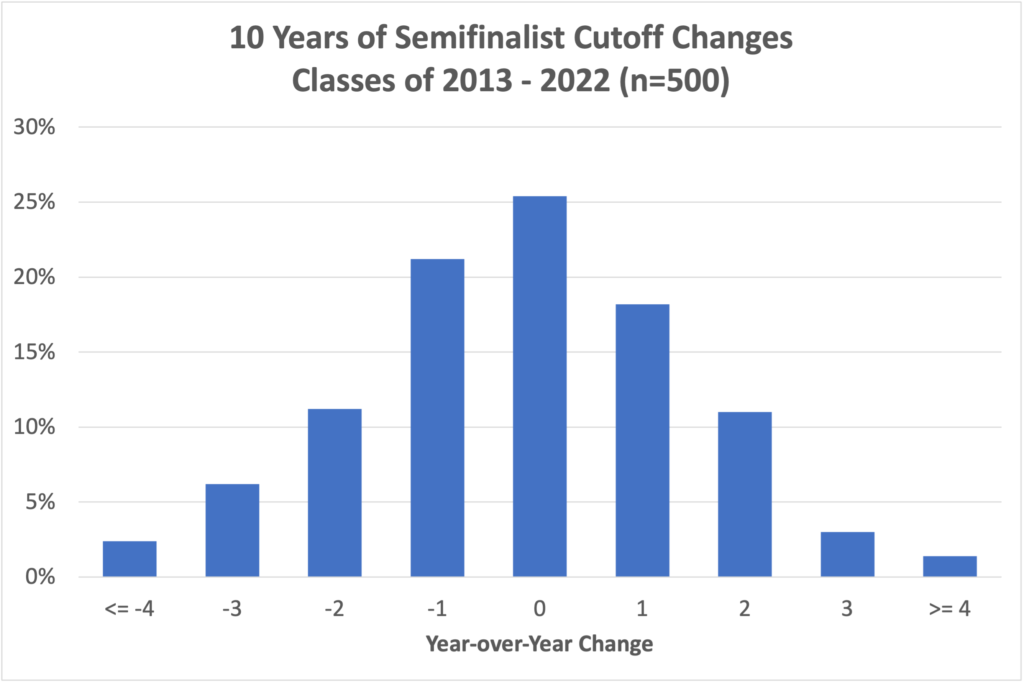
The chart below shows why class of 2024 students should not be complacent about simply matching this year’s cutoffs. In Compass’s historical archive, there has never been a year where more than 25 Semifinalist cutoffs stayed constant. The blue bars are the real threats, because they represent increased cutoffs.
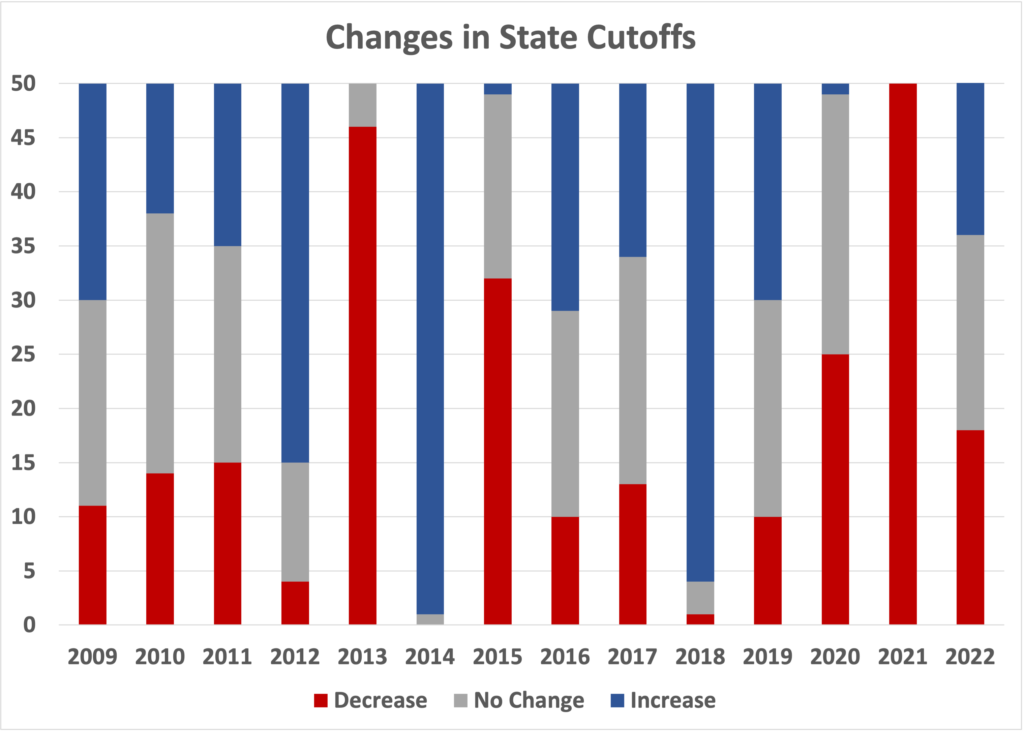
Changes, on average, tend to be lower in the states with higher cutoffs and higher in states with lower populations. The historical standard deviation of Alaska’s cutoffs is 3 times that of Connecticut’s, for example, and more than double that of New York’s.
The write-up below was to for the class of 2023 prior to the release of the Semifinalist cutoffs. We preserve it here because some of the ideas are useful in understanding how National Merit works and what the class of 2024 may see.
The Drop-Off in High-Scorers
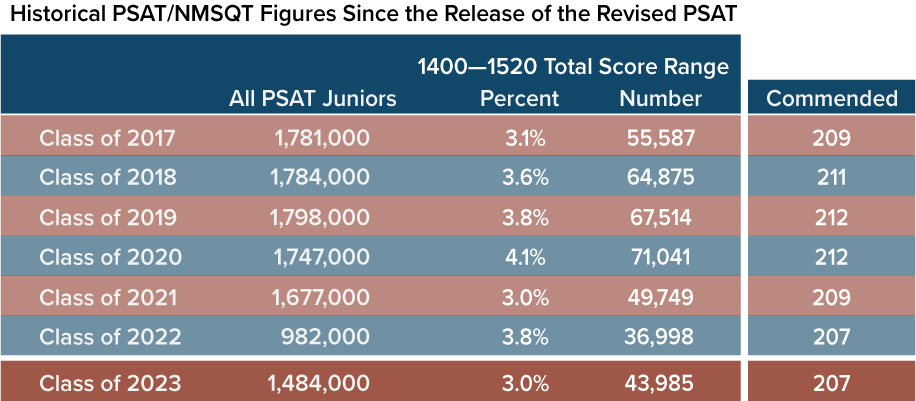
In December, Compass reported on the low number of high scorers on the October 2021 PSAT. Only 3% of test-takers achieved a score of 1400 or higher. Three things could produce that low of a figure: (1) the October 2021 exam had a challenging scale (what we saw with the October 2019 exam), (2) student learning has been impaired during the pandemic and test performance reflects it (what we saw on the 2021 APs), or (3) a disproportionate number of high scorers were unable (or chose not) to test. The first two cases, if true, would likely have a uniform impact across states. The third scenario is the wildcard.
Lockdown restrictions during the first year of COVID-19 were not at all uniform. California had only 13% of its usual volume of PSAT takers in 2019, whereas Florida achieved 82% of its prior year numbers. Fewer students taking the PSAT usually correlates with lower Semifinalist cutoffs. A return to normalcy, then, might indicate higher cutoffs. College Board does not release state figures until the fall, but we know that most schools were able to offer PSATs in 2021. The national volume for the class of 2023 was down only 12% from that of the class of 2021. Will the bounce-back in testing numbers for states like California, Oregon, and Washington mean higher Semifinalist cutoffs? How could cutoffs not go up with 6 times as many students in those states contributing PSAT scores this year? Answering those questions requires a diversion into the world of Alternate Entry.
What is Alternate Entry and did it break the NMSQT?
The junior year PSAT has served as the exclusive National Merit Scholarship Qualifying Test for more than 60 years. However, there has long been an exception for extenuating circumstances such as illness. For students who were sick on the day of the exam, NMSC allowed the substitution — pending an application by the school counselor and approval by NMSC — of an SAT score. Alternate Entry was uncommon and something of a rounding error. In fact, NMSC didn’t even need to use the entrants’ scores when calculating Semifinalist cutoffs. What if an entire country is ill, however? The pandemic forced NMSC to rewrite the rules for Alternate Entry. In states where 80-90% of students were unable to take the PSAT, what would National Merit have meant if all of them had been disqualified? In reaction to the pandemic, NMSC allowed students to self-apply and — so long as the student met the application deadline and didn’t have a PSAT on file — be automatically approved. NMSC had little choice but to incorporate the SAT scores of alternate entrants into the cutoffs.
Despite the radical change in testing volume and the impact of folding SAT scores in the mix, cutoffs for the class of 2022 were within the historical norms.* The hope is that the reverse is true this year: despite higher testing volumes, Semifinalist cutoffs will not climb precipitously. At the moment, we can only speculate. NMSC has been tight-lipped about how it will handle Alternate Entry applications and SAT scores in this years’ calculations. There is no source for the number of Alternate Entry applicants.
*[Maryland was decidedly outside the norms. All of the top NMSF-producing districts in Maryland had to cancel the PSAT/NMSQT. Most of the state’s Semifinalists qualified via the SAT, and this moved the cutoff to the highest ever recorded by any state. The students who were able to take the PSAT (about one-third of the usual volume) were at a disadvantage. The Alternate Entry system wasn’t designed for such a radical set of circumstances. Everyone is hoping to avoid another Maryland in the class of 2023.]
Commended versus Semifinalist, National versus State
The Commended cutoff is determined by looking at the top 50,000 scorers nationally. Semifinalist cutoffs, on the other hand, are determined state-by-state. The performance of students in Georgia or Michigan has no impact on the cutoffs in New York or Ohio. NMSC establishes a target number of Semifinalists based on the high school population in each state. California, for example, has a target of approximately 2,000 Semifinalists. NMSC determines the Semifinalist cutoff that comes as close as possible to producing 2,000 Semifinalists in the state. While this methodology ensures a national distribution of Semifinalists, it means that some states are far more competitive than others.
When your selection unit is not a state
The Semifinalist cutoff for each of the 50 states is calculated independently. However, some cutoffs are not independent. NMSC considers boarding school students, students studying abroad, and students in the District of Columbia and in U.S. Territories or Commonwealths as separate “selection units” that follow specific rules. The net effect is that the cutoffs for the District of Columbia and students studying abroad are always set at the level of the highest state cutoff. The cutoff for U.S. Territories is set at the Commended Student level (as it is with some states). The cutoff for a boarding school is set at the highest state cutoff within the boarding school’s region.
Expect cutoffs to resemble the low scoring classes of 2017, 2021, and 2022
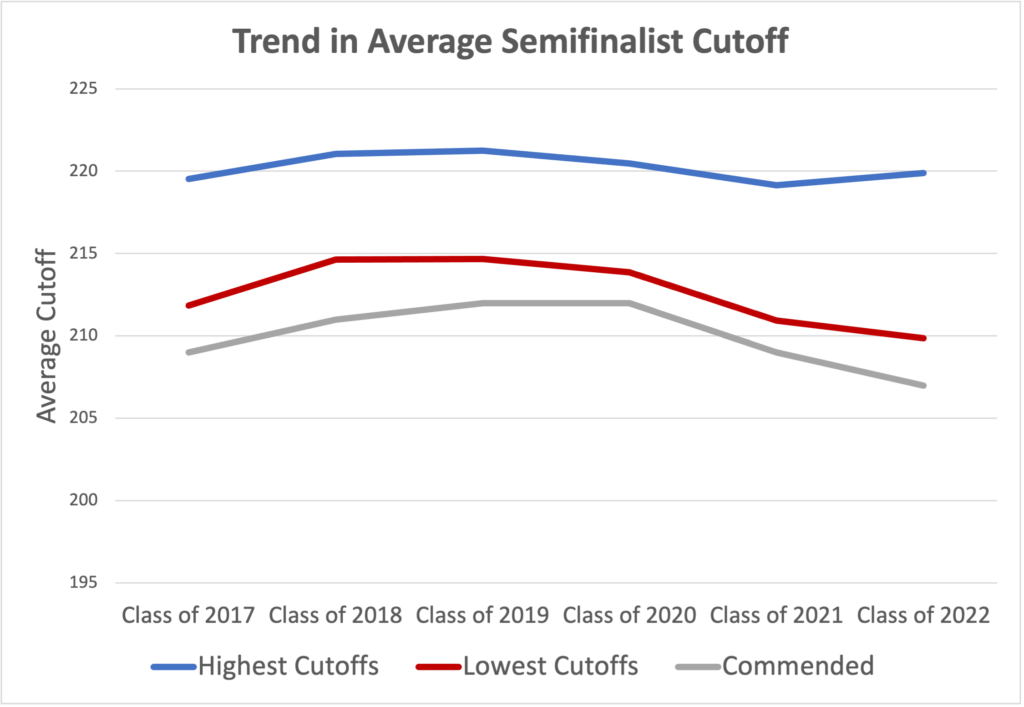
There have been 3 recent years where the Commended cutoff fell below 210 and 3 years where it fell above 210. In the low years, the cutoffs averaged 216, 215, and 215. In the high years, the averages were all 218. If the 224 in Maryland is considered an inauthentic result, the highest cutoffs were at 222 in the low years and 223 in the high years.
Below is a chart showing the lowest third of cutoffs and the highest third versus the Commended level for the last 6 years.
The Role of Test Scaling
The PSAT is usually taken by about 1.5 million students each year. The pool is large enough and consistent enough that the scores of the top 50,000 students should not change much. And yet they do. This reflects a shortcoming of the PSAT/NMSQT — it’s well-designed to measure the performance of the average student, but is more prone to error at the edges. College Board attempts to scale each PSAT so that a particular score represents the same level of achievement. In practice, we see clear examples of where College Board’s numbers are “off.” The class of 2021, for example, had an unusual test form that produced far lower cutoffs than in the previous year. Further confusing matters is that several different test forms are used each year. Compass’s analysis shows that this year’s PSAT — or at least the primary form, taken by more than 1 million students — was difficult. This difficulty can show up throughout the range of cutoffs, but lower scoring states tend to track the Commended level more than do the higher scoring states.
Why our Most Likely estimates are wrong
Confirmation of the low Commended cutoff makes us more confident of our estimated Semifinalist ranges, but the Most Likely figures could just as easily be labeled “Best Guess.” We know from tracking cutoffs in past years that “no change” is the most common result, and yet it only occurs about 1 time out of 4 (as mentioned at the top of the post, it is 1 time out of 2 when the Commended level is unchanged). Variability is the one certainty. See the chart below for a summary of changes in the last 10 years.
Also, test-taking behavior can change from year to year. In some states, the majority of juniors take the PSAT, which makes the competition more intense for Semifinalist spots. In states where the focus is more on the ACT than the SAT, on the other hand, PSAT participation and cutoffs tend to be lower. Participation rates are not static. Schools, districts, and entire states make decisions about what test to offer and to which students. For example, when Illinois and Michigan shifted from the ACT to the SAT, they saw higher cutoffs as an offshoot. Changes at the school and district level may have a less pronounced effect, but they can still shift the cutoffs.
Why our ranges are most likely right
It’s unusual for a state to break out of its historical norms. Given the weakness in scores this year, it is unlikely that we will see a state establish a new high. It’s more likely that scores will be aligned with other low years. Even in that narrowly defined group, fluctuations are the rule rather than the exception.
Is it possible to quantify the swings seen when “low” years are isolated? The table below groups states by size, because larger states tend to have more stable cutoffs.
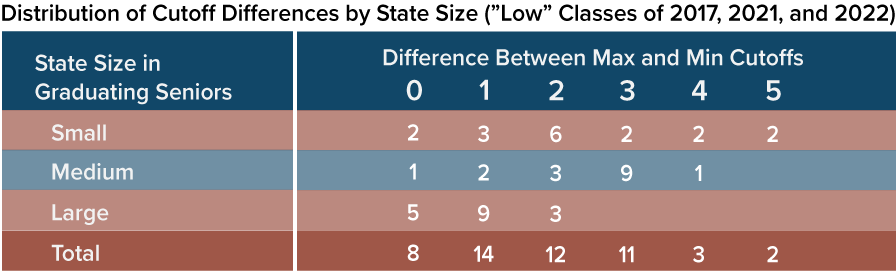
The difference between a state’s maximum cutoff in the classes of 2017, 2021, and 2022 is calculated versus its minimum. For example, the cutoffs for Florida were 217, 216, and 217, so the maximum difference was 1 point. There were a total of 9 large states that had the same difference. Five large states saw the same cutoff across all 3 years, and no large state had a swing of more than 2 points. By contrast, 10 of the 16 medium-sized states had swings of at least 3 points. Two of the 17 small states had differences of 5 points. It is wrong to assume that the data from three years is definitive. A state that had no change in those three years could see movement this year. The underlying idea, though, is solid. Swings happen. They happen more in smaller states. They are not always predictable by national results alone.
Small shifts can matter
It doesn’t always require a large change in testing behavior to cause a state’s cutoff to move. NMSC has no way of making fine distinctions within a state. Everyone at a given score is either a Semifinalist or not. The organization tries to come as close as possible in meeting the state’s allocation of Semifinalists (a number it does not directly report), but the nature of the Selection Index means that small variations can move a cutoff higher or lower.
Let’s assume that the target number of Semifinalists for a state is 300. If 282 students had Selection Indexes of 220 or higher and 315 scored 219 or higher, then 219 comes closest to meeting the target and will be set as the cutoff. If only 5 students at 219 had gotten 1 additional question right, there would have been 287 students at 220 or higher, and a 220 cutoff would have been chosen by NMSC. Small differences in class makeup, test form difficulty, or a few extra students guessing correctly on a problem can move the Semifinalist cutoff by a point.
Compass will update this post as new developments arise. We try to (eventually) answer all questions in the comments, but please be aware that comments are moderated and will not display until approved.
