Over the past few months, Compass has had the privilege of leading educational sessions for counselors and admission professionals across the country, including PCACAC (Harrisonburg, VA), WACAC (Long Beach, CA), and IACAC (Chicago, IL). More specifically, we’ve shared how the widespread adoption of test optional policies – galvanized by the COVID-19 pandemic – impacted admission outcomes for the classes of 2021 and 2022. This post will synthesize our findings and provide guidance to students, counselors, and parents who will be making important decisions in the months ahead.
The Current Testing Policy Landscape
Compass tracks the testing policies of 416 colleges across the US. In response to the closure of SAT & ACT testing sites during the pandemic, most universities suspended their testing requirements until site availability could be safely restored. These colleges initiated either temporary or permanent “test optional” or “ test free” policies.
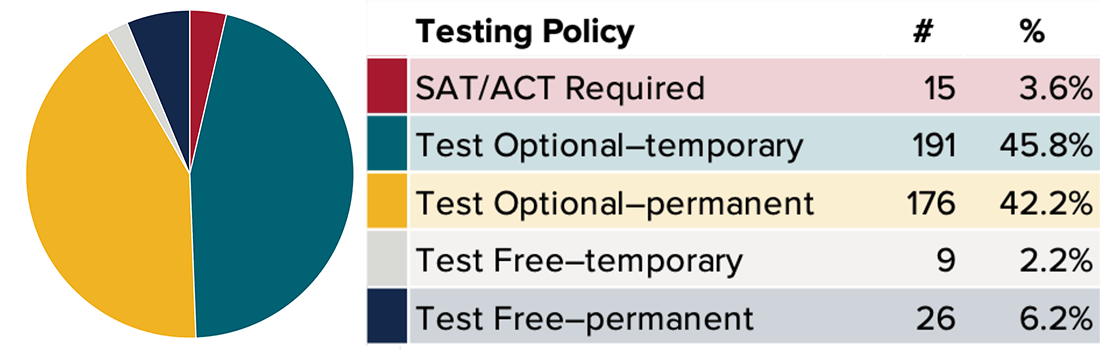
At its core, test optional means that a student’s application is complete with or without the inclusion of a test score. The decision to submit testing falls squarely to students, who must ask themselves, “Will testing increase my chances of acceptance or not?”
Alternatively, test free policies indicate that test scores will *not* be evaluated by colleges regardless of an applicant’s desire to share them. Examples of test free institutions include the University of California and Cal State systems, Reed College, Cal Tech, Cornell’s Colleges of Agriculture, Architecture, and Business, Hampshire College, and Worcester Polytechnic.
Other schools articulate a clear preference for scores. The University of Chicago encourages students to take the SAT or ACT, stating that these assessments demonstrate “evidence of academic achievement that exists outside of the context of your school.” Similarly, Carleton College claims that, “The results of standardized exams help the admissions committee judge candidates’ academic abilities…and potential.” With grade inflation on the rise,* it’s no wonder that these universities are leaning into standardized testing, especially when transcripts appear uniformly outstanding.
*College Board reported that over 60% of college applicants in the class of 2021 obtained a 4.0 or better. Teachers may have awarded higher grades to compensate for instructional challenges during the pandemic.
These test-preferred institutions are a minority under the test optional umbrella, but they tend to occupy top positions on national rankings. In contrast, the lion’s share of test optional schools could be described as test-additive or test-neutral. Their admissions offices insist that strong scores can improve an application, but the absence of an SAT or ACT will not penalize students. Colleges like Tulane, Gonzaga, and Wake Forest collectively agree that test scores should be submitted if they “accurately reflect academic aptitude” (Tulane Admissions).
Finally, we would be remiss if we did not mention the modest-but-growing number of schools that maintained or reinstated the SAT or ACT requirement. The University of Florida continued to require testing in spite of the pandemic. Auburn, Georgetown, MIT, and the University of Tennessee System will return to requiring admission tests for the class of 2023. MIT is an interesting case, because its rationale for returning to the SAT and ACT challenges the objections of testing critics. MIT admissions asserts that 1) the SAT and ACT, especially the Math sections, demonstrate essential readiness for intensive coursework, and 2) the assessments are more accessible and inexpensive than alternative testing – AP and IB Exams –which are tied to highly specific curricula, offered once per year, and incur costly fees.
Apps Rise, Admits Decline, Yield Defies Expectations, and Scores Climb
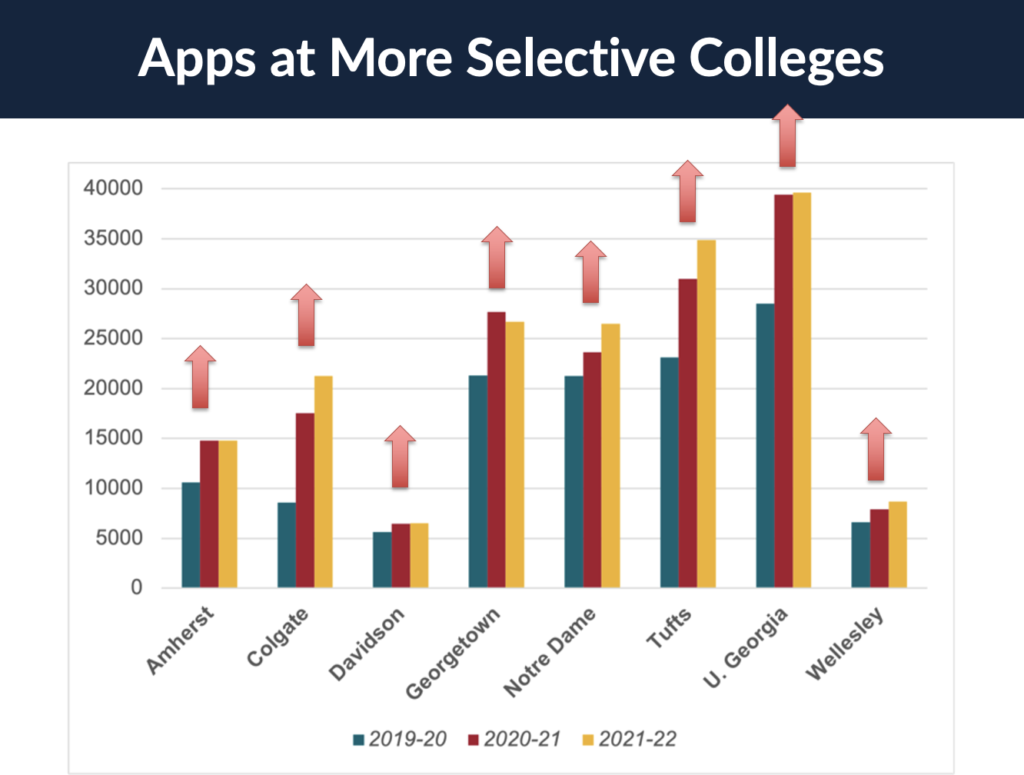
Without the impediment of testing requirements, students in the classes of 2021 and 2022 applied in far greater numbers to more selective colleges. Applicant pools ballooned – more than doubling in the most extreme cases (e.g. Colgate University) – and admission offices scrambled to handle the influx of interest. In fact, without any expansion to their incoming classes, popular colleges were forced to deny more students than ever before. Acceptance rates plunged in response to the outsized demand, and both families and counselors lamented the increased competition for coveted spots.
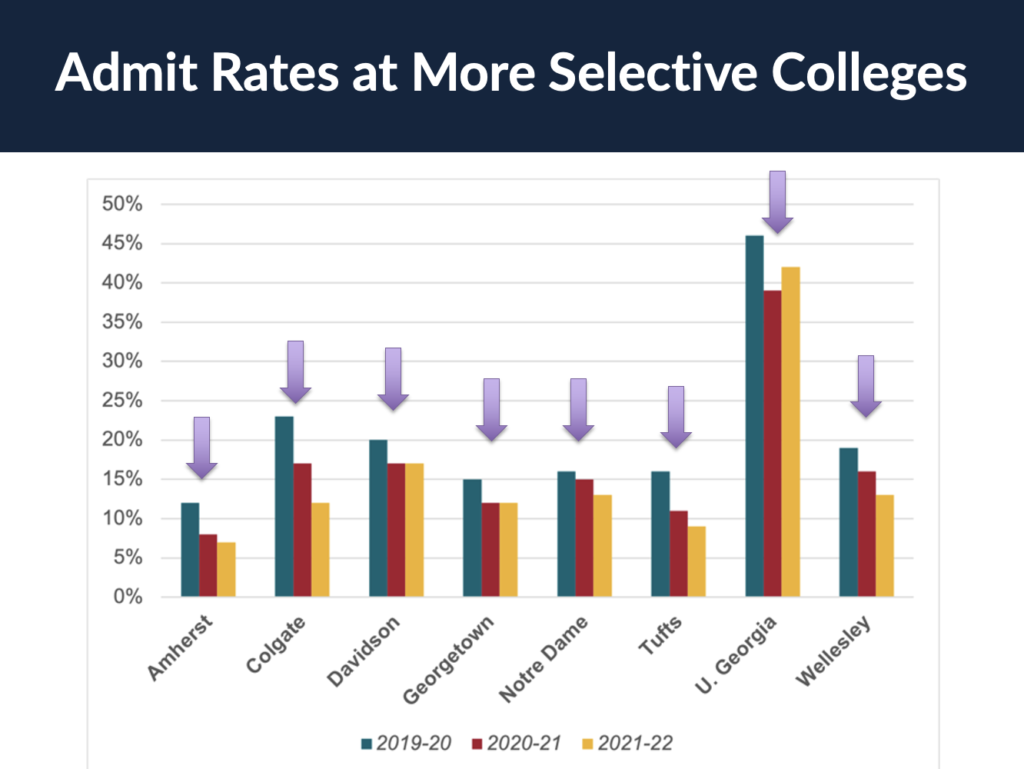
Although sinking admit rates were a defining feature of the most recent admissions cycles, declines mostly leveled off for the class of 2022. That said, eye-popping figures from highly selective schools – like Boston College (16% acceptance rate) and Notre Dame (12.9% acceptance rate) – have garnered media attention. Auburn University made headlines when its 85% admit rate plummeted to 24% in just two years.
Record applications and plunging admit rates were not the only phenomena manifested by test optional policies. The massive upswing in apps – combined with the omission of SAT & ACT scores – destabilized yield predictions for enrollment managers. In a recent webinar with Compass, Calvin Wise, Director of Recruitment at Johns Hopkins University, remarked, “I need to enroll a certain number of students – 1300 at Hopkins – each year. There are problems when we have 1325. There are problems when we have 1294.”
Because the classes of 2021 and 2022 tossed their proverbial “hats in the ring” at a much wider array of schools, some colleges were compelled to pad their numbers and accept more students. The outcome: institutions inadvertently over-enrolled their incoming classes. For instance, over-enrollment for the class of 2021 at Texas Christian University, the University of Illinois, and USC led to a reduction of spaces the following year. In a 2021 interview, Andy Borst, the Director of Admission at the University Illinois, explained that, “in order to ensure that we are maintaining our undergraduate enrollment within the bounds of university resources, we are planning to intentionally reduce our target by approximately 600 students to be more in line with previous years.” Although we are still waiting on final confirmation from the University of Illinois, we anticipate that the enrollment cap will lead to the university’s lowest acceptance rate in history.
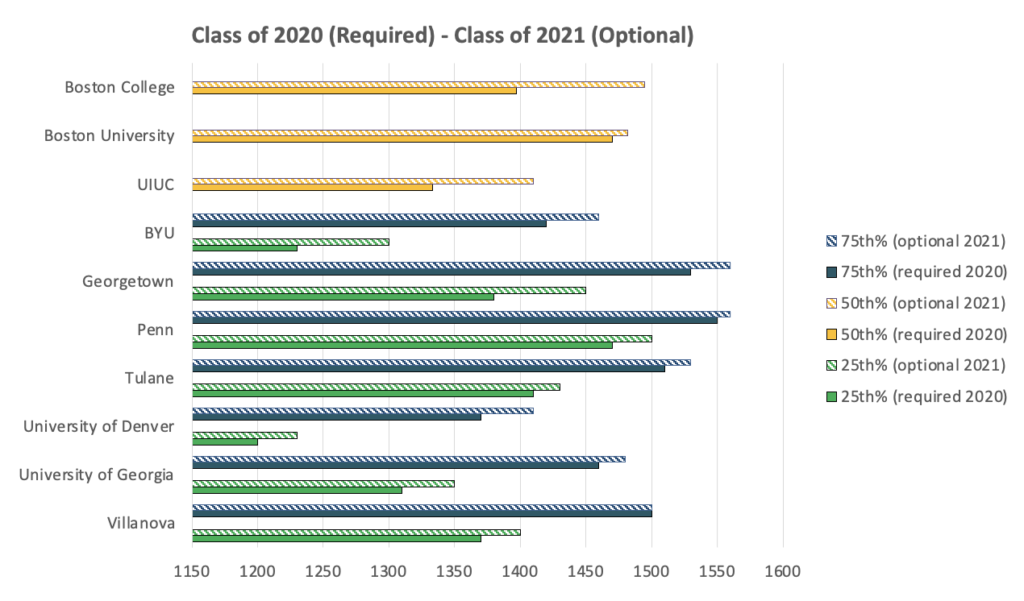
Lastly, with the option to withhold subpar scores, many students only applied with SAT or ACT results that aligned with or exceeded colleges’ prior averages. As a result, the middle 50% of score ranges significantly increased (see chart above), and students wondered if higher scores would become necessary for admission. To neutralize anxieties, colleges such as Northwestern and Yale advised students to reference pre-pandemic testing data. Similarly, we recommend that counselors and families treat the last two years as anomalies. A solid score today is the same as it was 3 or 4 years ago.
Admissions Advantage for Submitters of Test Scores
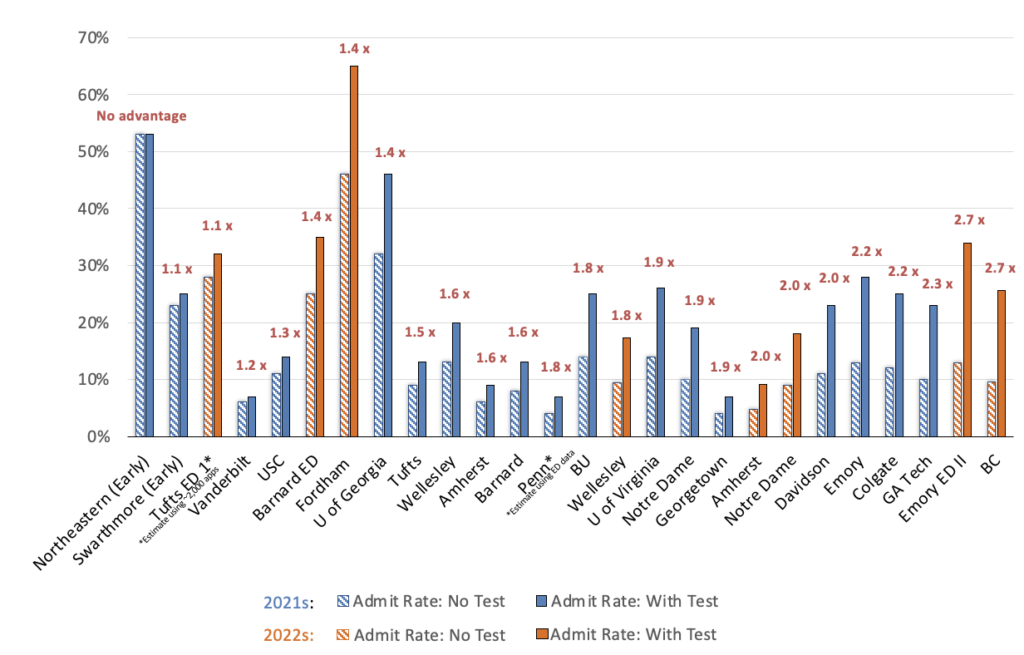
In the chart above, we’ve collected admit rates among submitters and non-submitters of SAT and ACT scores at more than two dozen colleges that have released full information. According to the data, for example, score submitters at Boston College were admitted at 2.7 times the rate of non-submitters. At Georgia Tech, the figure was 2.3 times. This chart has become a great source of consternation for champions of the test optional movement and critics of college admission testing. Universities located toward the left side of the x-axis admitted more even ratios of submitters and non-submitters (e.g. Northeastern, Swarthmore, Tufts, and Vanderbilt). Colleges clustered to the right of the x-axis admitted far fewer students without testing; for example, test-submitters to Emory (EDII) and Boston College were admitted almost three times more frequently than non-submitters.
It’s important to acknowledge that this data does not contain *any* information about the nature of submitted scores. The simple act of applying with an SAT or ACT does not increase your odds of acceptance. Instead, we argue that strong scores – which are differentially defined by colleges and their institutional priorities – are more valuable than the absence of scores. Relatedly, students with high test scores tend to have other correlating features that make them desirable. High-scorers are often academically strong, attend well-resourced schools with rigorous curricula, and may have access to dedicated college counselors.
Testing Guidance for Students
Pending exceptional circumstances, Compass advises students to sit for the official SAT or ACT. However, the decision to submit scores should be made on a case-by-case basis and informed by testing data and policy language.
Coincidentally, our own guidance parallels much of Grinnell College’s advice to applicants:
- If you think your scores are an accurate representation of your ability, then you should feel free to submit them. If you feel they are not, then don’t submit them.
- If you get the score you hoped for, and especially if it’s above average [for the college], submitting the score may help you in the admission process.
- Test scores are considered in context. Even if your score is not above average for [the college], but it is for your high school or neighborhood, your score may help you in the admission process.
- A high SAT or ACT score can offset a low GPA*. If you don’t submit a score, we have less information about your academic performance. If you have a low GPA but do well on the SAT or ACT, your test score can be an important indicator of your potential to succeed in college-level classes.
*This last point is occasionally misunderstood by families. Test scores can have redemptive value and soften the rough edges of a transcript (i.e. a middling semester or an uncharacteristically low grade), but they will never supersede the importance of cumulative GPA.
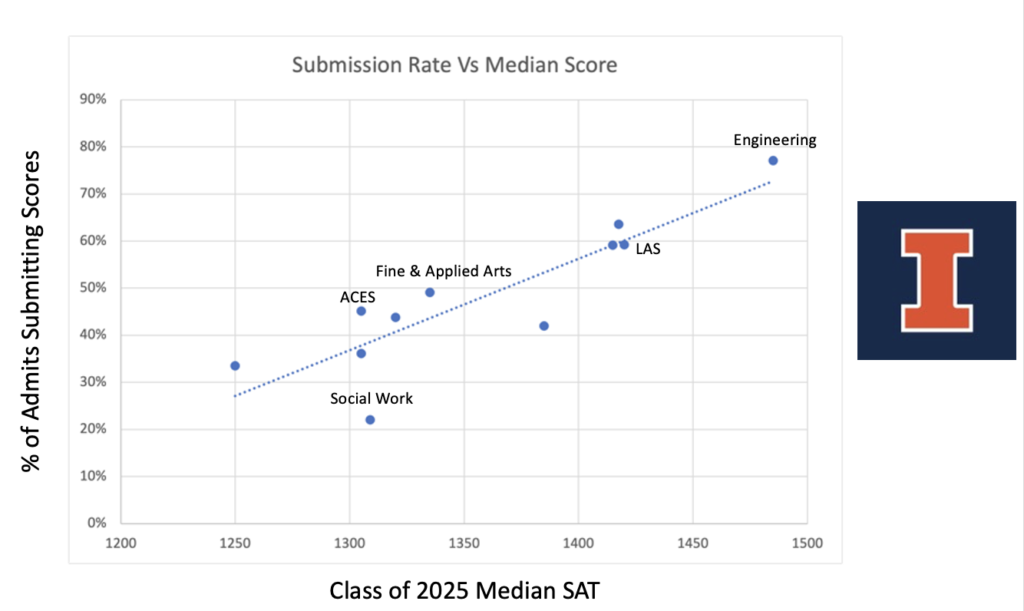
In summary, although the SAT and ACT are standardized, decisions regarding submission are not monolithic and will vary across a student’s college list. To invoke the University of Illinois one final time, the chart below displays the median SAT scores and percentage of submitters to different colleges & degree programs. Students admitted to the Colleges of Social Work and Fine and Applied Arts rarely applied with scores, and on average, their scores were much lower than those of students admitted to the College of Engineering. One conclusion is that the higher a student’s score, the more advantage provided – hence, the higher submission rates. Students made rational decisions based on their scores. The data also show that an applicant’s decision to test and submit scores may not only shift between colleges, but may also differ for students applying to the same institution.
A Word on Testing and Equity
Unsurprisingly, most families who engage with Compass feel that admission testing is still an essential component of their applications, especially if they are vying for limited spaces at popular schools. “Test optional” is often perceived as “test expected,” and the strategic nature of score submission poses a new hoop to leap through. But our clients are not necessarily representative of the typical high school student, many of whom do not have ample opportunity to take multiple SATs or ACTs, receive personalized advising from counselors, or access one-on-one test preparation.
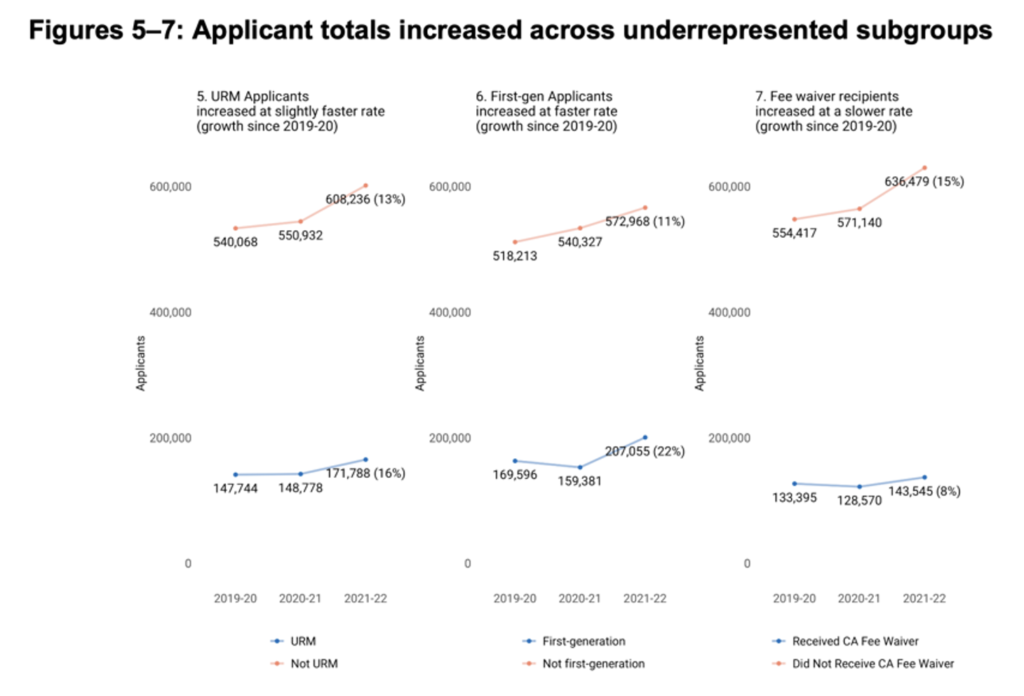
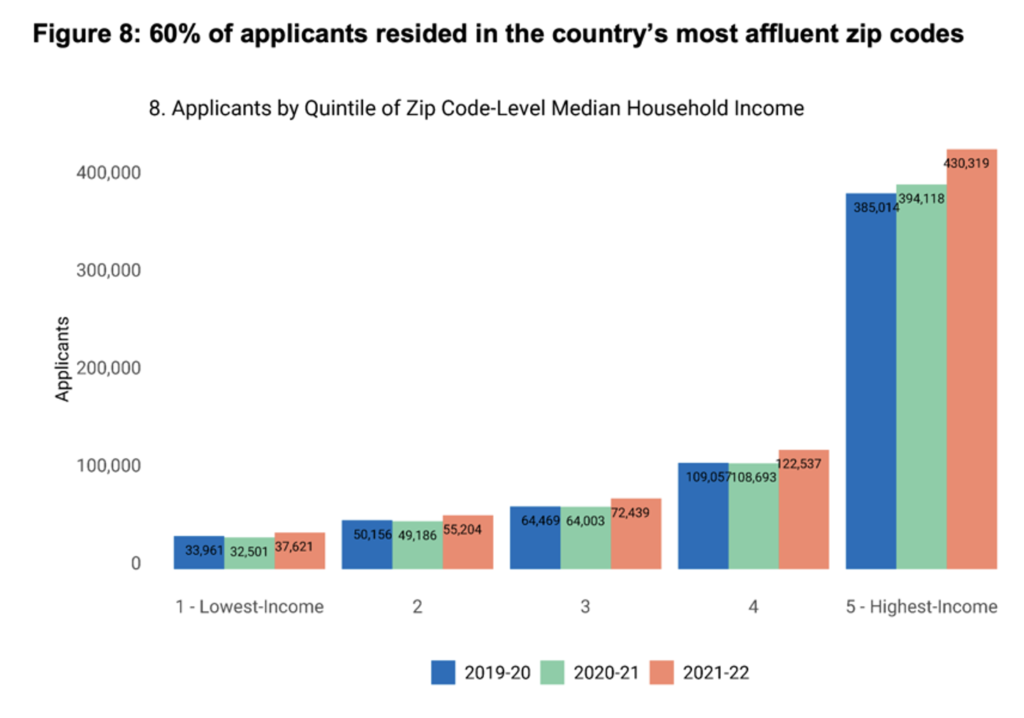
Statistics from the Common App Report in late 2022 (above and below) show that test optional policies contributed to a modest increase in applications among underrepresented minority students (URMs), first-generation students, and students who requested fee waivers. Nevertheless, relative application growth was largest among non-URM students in the wealthiest quintile.
Enrollments directly tied to test optional policies are difficult to decipher. In an analysis of admission data among test optional colleges, a study in the American Educational Research Journal found that flexible testing policies increased apps among URM students but only improved enrollments by 1% across a fifteen year period. The results suggest that test optional policies must be one of many initiatives to meet colleges’ goals for improving on-campus diversity.
Expectations for the Future of Admission Testing
Over the last two years, students have demonstrated widespread enthusiasm for test optional policies. But newfound flexibility has inspired greater uncertainty: Should I test? Are my scores worth sending? Which colleges should receive my scores? The excitement to sidestep testing may be dampened by data from many popular colleges, which indicate that testers with strong scores retain an advantage over those who forego testing.
On the college side, we can sense similar ambivalence about test optional policies. Beyond the warm language that often adorns their websites, many admission offices must create new formulas for evaluating applications with and without scores. In the absence of scores, it is unclear which elements of the holistic review will obtain greater importance (though Compass’ own research points to AP coursework and Exams). Stay tuned to Compass for the latest updates, especially as the digital SAT makes its debut in the spring of 2025.
Matty,
Thank you so much for this cogent analysis and for the clear and readable graphs. It offers some perspective on the outcomes of these past two admissions cycles (even though many other factors have been involved as well!)
Matty,
Thank you for this insightful analysis! This is the type of data I have been looking for. Great work!
Great post thanks for sharing