
The June 2018 SAT has received a lot of negative attention because of its abnormally harsh curve. Among the questions we look at below:
- Were scores actually lower in June or were they simply perceived to be lower because of the harsh scale?
- Was the SAT graded correctly?
- Was the June SAT too easy to provide accurate scores?
- Were students on some parts of the scale negatively impacted by too many easy questions?
- How did such an outlier test get released?
Raw scores versus scaled scores
Students often judge their performance based on how many questions they got wrong, but standardized tests are not graded by raw scores alone. Question difficulty and scale harshness must be in equilibrium in order to make the SAT and ACT fair across different test dates. Three wrong on the May 2017 Math test, for example, would have produced a scaled score of 770. Three wrong on the easier June test would have produced a 720. The phrase “lower than expected” came up often in June SAT discussions because of this difference in scaling. While the June SAT was abnormally easy across all three sections, the focus below will be on Math.
Was June really that easy?
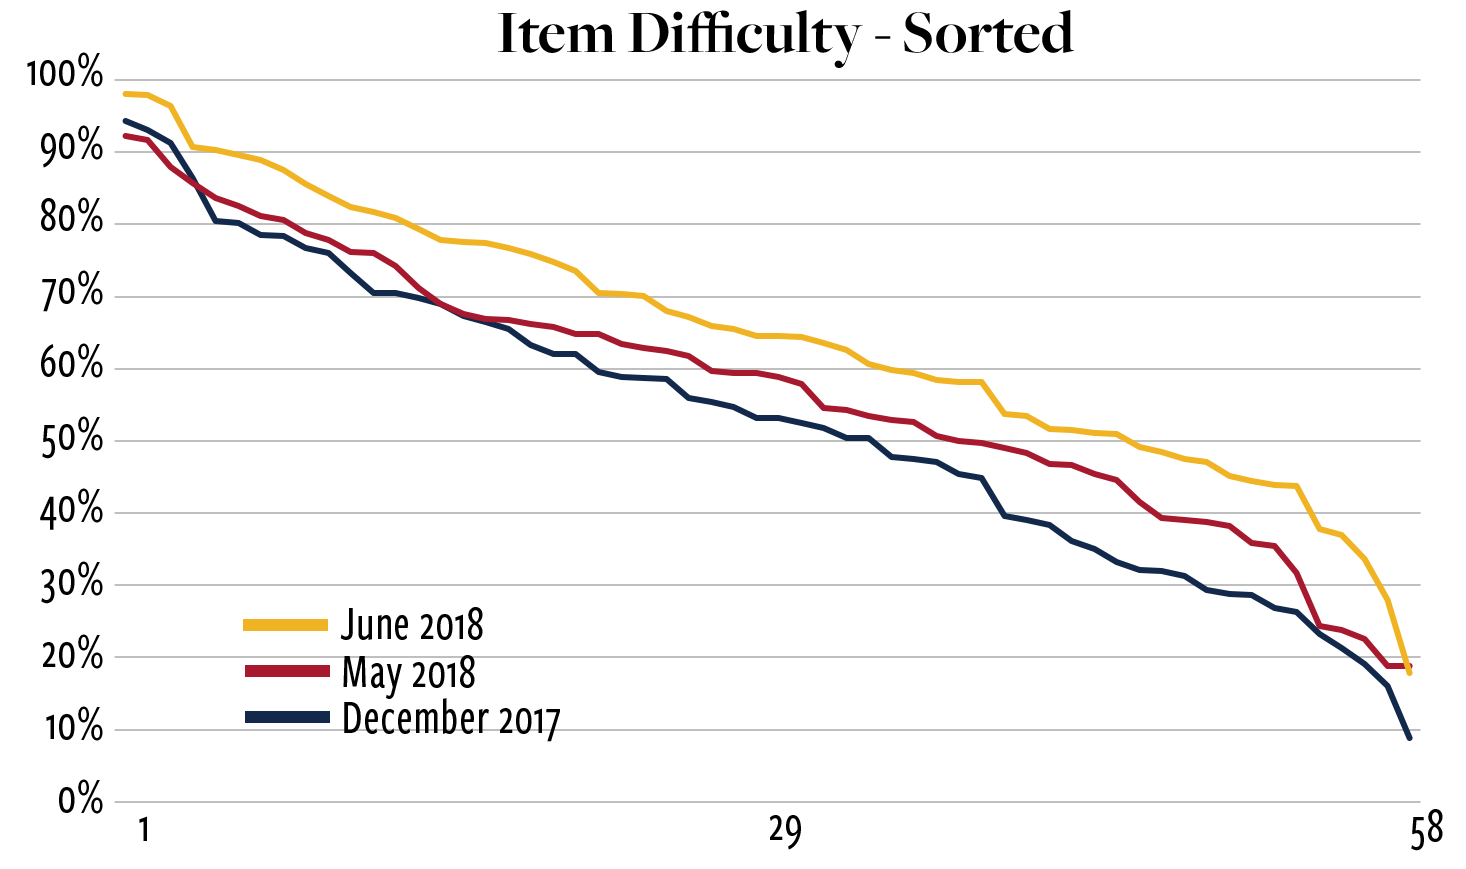
Questions on the SAT range from very easy — those answered correctly by more than 90% of students — to very hard — those answered by fewer than 30% of students. The chart below orders the 58 Math questions on the December 2017, May 2018, and June 2018 SATs in order of difficulty. The differences are shocking. The easiest questions are easier. The hardest questions are easier. Everything in between is easier. The June test was an outlier’s outlier.
Were scores in June lower?
From the statistics reported by College Board, it appears that scaled scores were not lower overall. Our analysis takes advantage of the fact that the pool of students taking a given test date stays relatively consistent from year to year. The June date is dominated by juniors looking to get in a first or second official score before the summer.
- The average score on the June 2017 SAT was 1111.
- The average score on the June 2018 SAT was also 1111.
No change.
The students most concerned about the odd scaling were high-scoring test takers who saw even a few errors pull down their scores.
- 6.65% of students scored 1400-1600 Total Score on the June 2017 SAT.
- 6.65% of students scored 1400-1600 Total Score on the June 2018 SAT. No change.
No change.
This doesn’t prove that the test was fair, but it indicates that scores, as a whole, were not dragged lower.
Is there a simple way of understanding how different the June SAT was from other SATs?
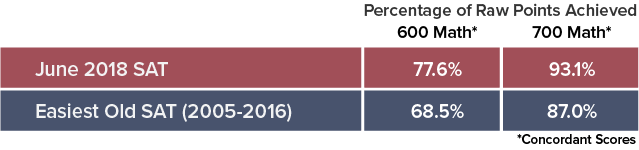
One way of assessing the raw difficulty of an SAT is to look at the percentage of questions students at a particular score answer correctly. Students achieving Math scores of 600 and 700 on the June SAT correctly answered 45 out of 58 questions (77.6%) and 54 out of 58 (93.1%), respectively. How do those percentages compare to other tests?
The June SAT was considerably easier than any of the other 14 new SATs that have been released.

The June SAT was much easier than any of the 50 released old SATs that Compass has documented.
The June SAT was even easier than any of the 8 new PSAT/NMSQTs College Board has given!

This last comparison is particularly troublesome. PSATs are designed to be easier than SATs because they are taken by 10th and 11th graders near the start of the school year. College Board understands that the PSAT is too easy to accurately predict higher scores, so it caps the scale at 760. If the PSAT is too easy to predict 770-800 scores, and the June SAT was easier than every new PSAT given, what does that say about the form’s ability to predict high scores?
Is there any evidence that College Board misgraded the exams?
The released data does not show that exams were misgraded. The table below shows the number of correct questions (raw points) students averaged on the December 2017, May 2018, and June 2018 SATs. The December and May exams reflect more typical levels of difficulty and are included because the test taker profiles approximate those from the June SAT. [June 2017 question data were not available.]
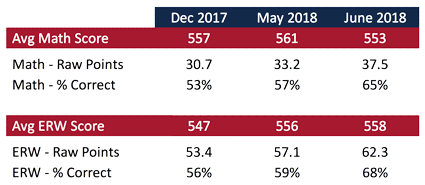
June SAT students scored 4.3 raw points higher than similar students taking the May SAT and almost 6.8 points higher than those taking the December SAT. We might say that the December test was 22% easier than June [6.8 / 30.7 = 22%].
To properly compare May and June students, we need to adjust for the 8 point difference in scaled scores, 561 versus 553. That’s a difference of approximately 0.8 raw points. This means that had June students been handed the May form, they would likely have earned 5.1 points more [4.3 + 0.8] more than they did on the June form. That approximately 5 point difference is what we see reflected in the scale. For example, a student in May needed 45 raw points to earn a 650. A June test taker needed 50 raw points. Only overall student performance numbers are available, so we cannot do the same calculation at the very top scores. The numbers we can see, however, indicate that College Board properly set the scale to adjust for the easier questions.
Can a scale be correct and unreliable at the same time?
A score on a standardized test is just an estimate of a students “true score.” One way of defining the accuracy of that estimate is the probability that the student’s true score falls within a certain range of the test score (“observed score”). While it often gets overlooked, every SAT report provides a range for the student’s scores. This range is +-30 points on Math and ERW. It is expected that a student’s true score falls within this range about 68% of the time. This standard error of measurement, though, reflects the error across the full 200-800 range of scores. The error can differ along the scale and from test to test. The June SAT’s oddity means that its accuracy in estimating true scores among high scoring students would have been worse that on any other new SAT.
Did any student earn an 800 Math?
The intentionally provocative answer is “No.” Among the 300,000 testers, I am sure that many received 800s, and I don’t mean to call their results into question. The scores were achieved under the same rules that have been used for decades. Answering all questions correctly must always produce an 800. It doesn’t matter how hard or easy the problems are, this is simply definitional. If the scaling had been allowed to float free, though, it’s unlikely that even a perfect raw score would pencil out to an 800. The steep drop-offs in the raw-to-scaled conversion — 770, 750, 720, 700 — indicate that the scale on this test was unnaturally extended. The June SAT was a PSAT masquerading as an SAT.
Most SAT forms have a range of hard problems that are important in distinguishing high-scoring students. The December test had 19 Math problems where students had lower than 40% success. The May test had 12. The June test had 5! The gross differences between June and all previous new SATs should have been obvious during the construction process. If a test this easy is not considered out of spec, it might be time to revisit the specs.
Does this all mean that June scores need to be thrown out?
Accepting some degree of fuzziness is required with any test results. If a history teacher were to draw up a new final exam and have students retest, it’s highly unlikely that their scores would be unchanged. We don’t put an asterisk next to an exam and note that a student’s A- was “only accurate on this date and for these questions.” Nonetheless, College Board should be more forthcoming about what standards it expects from its standardized tests and not hide behind overall statistics that tend to disguise questionable decisions.
Did taking the June SAT hurt students?
It’s impossible to say whether individual students were negatively or positively impacted by the difficulty mix in the June test. What the average scores show is that as many students benefited from the mix of easy test/harsh scale as were disadvantaged by it. This also fits with the mathematical model. A lower test reliability doesn’t move scores, it just makes them fuzzier. The differences between observed scores and true scores are more pronounced, but the error points in both directions. It’s important to distinguish between students’ anger that a given number of questions wrong produced a lower score in June and the concern that their scaled scores misrepresented their ability.
Does the fuzziness mean that high scoring students should retest?
Compass would recommend applying the same standards as for any other administration. Does the student feel like he or she can perform better with another try? Will that improvement be enough to matter? Does a retest fit into his or her college application timeline?
Will or should colleges view June test results differently?
Admission officers should not allow small differences in scores to sway their decisions. The June test simply highlights what has always been true. A single SAT (or ACT) score is not the final verdict on how a student can perform. It inherently has error in it. A college that views a 750 as higher than a 720 must wrestle with the fact that a single question on a single exam resulted in such a difference. It’s not wrong to hold that view, but is it wise? Perhaps the June SAT can serve as a wake-up call to colleges that scores should always be viewed as fuzzy and that they must demand more accountability from College Board and ACT.
What is the wider impact of the poor construction of the June SAT?
Psychometricians, the experts who create and study tests, point to the robustness of standardized tests. Test forms can differ substantially and still produce consistent results. Such irregularities, though, are becoming far too regular at College Board. There have been problems with discarded questions — 4 on this test alone — problems with test security, and problems with scaling. Most of all, there is a problem with reporting and transparency. College Board says nothing of substance when problems do arise. The June Math test was the easiest SAT — perhaps ever — yet College Board has not explained why it produced such an outlier or how it could not have lowered the reliability of high scores. At a time when the new SAT still has much to prove and standardized testing itself is being questioned, College Board has not shown itself to be the leader it once was.

Hi Art,
Thank you for this informative article. Question: What did you think of the October 2018 SAT? It seems that the College Board considered the writing section much easier therefore the equating was much harsher.
Eileen,
Yes, the October 2018 test is another example of a test with easy questions and harsh curves. The Math was easy (harsh curve), but not quite as easy as June. The Reading test was unusually easy (harsh curve). But, as you say, it was the Writing test that was a complete outlier in terms of how easy the questions were and how harsh the curve. It’s not clear if College Board has decided to change the test structure or if they are just flailing.
Hi Art,
i really liked your article and the way you have analysed. i just wanted to know about the complexity level of the SAT paper which was conducted on the first of december 2018.
Pallav,
I haven’t yet received any information about the scale for the December test. I’m wary of basing statements off of students’ recollections of what was “hard” or “easy.”
Hi Art, I’m curious what you think of the December 2018 SAT now that results have been released. It seemed much easier than others and seemed to be scored more harshly than the Aug 2018 test.
Jenna,
Yes, the Writing, in particular, was abnormally easy (i.e. harsh curve). The Reading and Math skewed quite easy, but they weren’t off the charts. It’s unclear if College Board is switching up difficulty long-term or if they have just had a hard time maintaining stability.
Hi. On the May 2019 SAT I only got one question wrong on the SAT math section and I got a 770. Does that mean that it was impossible to get a 780 or a 790 on this test?
Jonas,
Yes, that’s exactly what it means. Test makers try to have a range of question difficulty that allows them to have scores mapped across the entire set of scaled scores. College Board has had trouble maintaining this standard, and we’ve seen a number of tests skew “easy.” This means that holes get left at the top end of the scale.
Hey, when will you review the May 2019 SAT? I feel the marking was harsh.
Alden,
I haven’t seen the full scale yet. Another commenter got 1 wrong and scored a 770. That’s the drop-off we saw in the June 2018 test discussed above.