
April 6 Update
It appears that the conclusion reached in our original version of this post have been confirmed. Two commenters on our primary cutoffs post have called NMSC today and been told that the Commended Student cutoff is 211 for the class of 2018. That is up 2 points from last year’s 209. This likely means that a majority of state cutoffs will rise. I am preparing an analysis of prior Commended moves to see if we can get a better sense of how likely we are to see 0, 1, 2, and 3 point changes in state cutoffs. This analysis cannot, of course, predict which individual states will rise, but it will present students with a better sense of how scores stack up. Expect an updated article no later than a week from today.
Semifinalist cutoffs will rise for the class of 2018.
The most common question about National Merit is “Will cutoffs go up or down?” Since PSAT scores were released in December, I have been trying answer that question. Based on the evidence presented below, I now believe cutoffs for the class of 2018 will be higher than they were for the class of 2017.
When I say that National Merit scores will rise this year, I am not saying that all state cutoffs will increase. There is solid evidence that the Commended Student cutoff will increase. When this level has increased in prior years, more state cutoffs have gone up than down. The higher the Commended level, the more likely that state cutoffs will move in that direction. State-by-state data is still unavailable, so I cannot predict exactly which states will increase or by how much. For an overview of where Semifinalist cutoffs were for the class of 2017 and where they might be for the class of 2018, I recommend Compass’ post on NMSF cutoffs.
Mean Scores are Higher
The first bit of information we received shortly after scores were released was that the average total score had gone from 1009 to 1019 (more exactly, from 1008.83 to 1018.51). This increase, by itself, was not conclusive. National Merit scores apply to an elite group of test-takers, and mean scores can be influenced by many parts of the score range. As I had the opportunity to dig deeper into score distributions, however, it became clear that the upper end of the score range (1400-1520 in College Board reports) was a factor in the increase. I had previously noted (in comments) the distributions as whole percentages, but I now have data that gives student breakdowns. It makes for a more compelling story.
Top Scores Show Largest Increases
As shown in the table below, the number of students scoring at 1400 or above went from 55,587 for the Class of 2017 (October 2015 PSAT juniors) to 64,875 for the Class of 2018 — an increase of 16.7%. In fact, the largest percentage increases were in the highest score ranges. Scores across the board seem to have had an upward push.
PSAT Score Range Changes - Total
| Score Range | Class of 2017 # | Class of 2017 % | Class of 2018 # | Class of 2018 % | Change |
|---|---|---|---|---|---|
| 1400-1520 | 55,587 | 3.1% | 64,875 | 3.6% | 16.7% |
| 1200-1390 | 255,631 | 14.4% | 273,791 | 15.4% | 7.1% |
| 1000-1190 | 598,975 | 33.6% | 615,095 | 34.5% | 2.7% |
| 800-990 | 619,394 | 34.8% | 582,287 | 32.7% | -6.0% |
| 600-790 | 239,747 | 13.5% | 237,432 | 13.3% | -1.0% |
| 320-590 | 11,736 | 0.7% | 9,773 | 0.5% | -16.7% |
| Total | 1,781,070 | 0.0% | 1,783,253 | 0.0% | 0.1% |
It should be noted that not all PSAT takers are National Merit-eligible — primarily because of the requirement for U.S. citizenship. We can’t directly use the 55,587 figure, for example, to compare to the 52,000 to 53,000 students typically achieving Commended status or above. We must also be careful when using total score instead of Selection Index. The class of 2017 total score figures, though, seem to correspond well with the 209 (Selection Index) Commended cutoff. The 64-thousand student question, then, is what does the increased number of students in the upper range mean for this year’s cutoff?
Score Increases Within Sub-Groups
An important question is whether or not the increases impacted all student segments — especially those segments that already had high numbers of top scorers. We might be able to argue that the 3.1% to 3.6% change in 1400-1520 scorers occurred because of some students being pushed just over the line from 1390 to 1400 or 1410. A sub-group with a dense population of 1400-1520 scorers, though, is also going to consist of many 1450+ students. Increases in those sub-groups provide evidence that scores increased virtually everywhere along the PSAT range.
College Board only provides a few ways of looking at PSAT data. Level of parent education is useful for our purposes because of its correlation to higher scores. For example, students whose parents have graduate degrees are almost 6 times as likely to fall into the 1400-1520 range as students whose parents do not have graduate degrees. In fact, these students represent 61% of the 1400-1520 bin. This would strongly imply that this segment has a high population of 1450+ scorers. As with the overall numbers, we see the largest percentage gain among students falling in the top bracket.
PSAT Score Range Changes - Parent Ed, Grad School
| Score Range | Class of 2017 # | Class of 2017 % | Class of 2018 # | Class of 2018 % | Change |
|---|---|---|---|---|---|
| 1400-1520 | 34,367 | 8.9% | 39,825 | 10.2% | 15.9% |
| 1200-1390 | 105,330 | 27.2% | 112,896 | 28.8% | 7.2% |
| 1000-1190 | 147,801 | 38.2% | 148,241 | 37.8% | 0.3% |
| 800-990 | 81,601 | 21.1% | 73,516 | 18.8% | -9.9% |
| 600-790 | 17,438 | 4.5% | 16,752 | 4.3% | -3.9% |
| 320-590 | 706 | 0.2% | 590 | 0.2% | -16.4% |
| Total | 387,243 | 391,820 | 1.2% |
I also looked at a segment of students using multiple slices (confidential). This segment included only 42,151 students in the class of 2017 (about 1 student for every 42 PSAT takers) but represented 21% of 1400-1520 scorers. Not only did this group see an increased percentage of students in the top bucket for the class of 2018, it also saw almost an 11% increase in testers. Overall, this segment — one we can surmise had many 1450+ scorers — saw a 20% increase in students in the 1400-1520 range. Below I’ve provided a graphical view of the change to illustrate how the PSAT score “wave” got shifted to the right and, presumably, sloshed into even the very upper reaches (i.e Selection Indexes above 220).
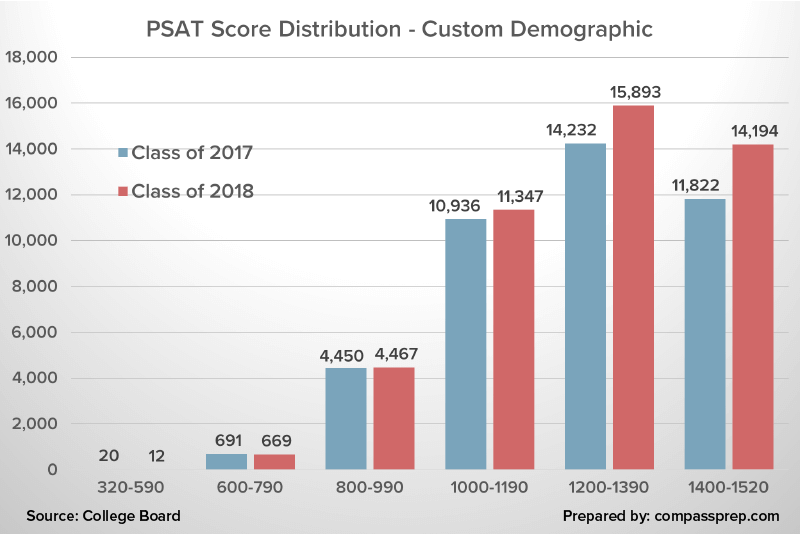
Total Scores Versus Selection Indexes
One important caveat is that these figures are for total scores. College Board does not provide similar breakdowns of Selection Indexes. Because the EBRW score has twice the weight of the Math score, we cannot guarantee a perfect correlation between total score and Selection Index. Perhaps much of the increase occurred on the Math side — maybe even with EBRW scores going down. Unfortunately, this is not the case. In fact, EBRW scores seem to have increased more than Math scores. Below are the average PSAT section scores by level of parent education. Scores increased at all levels, and EBRW scores led the way. This means that it is possible that Selection Index scores saw more of an upward push than total scores.
PSAT Scores by Parent Education Level
| Parent Education Level | 2017 | 2018 | (2017) | (2018) | (2017) | (2018) | Chg | Chg |
|---|---|---|---|---|---|---|---|---|
| All | 1,781,031 | 1,782,719 | 507 | 513 | 502 | 505 | 6 | 3 |
| No Response | 115,032 | 114,096 | 425 | 438 | 434 | 440 | 13 | 6 |
| No HS Diploma | 142,682 | 151,051 | 432 | 437 | 443 | 442 | 5 | -1 |
| HS Diploma | 487,936 | 484,347 | 473 | 477 | 470 | 471 | 4 | 1 |
| Associate Degree | 132,934 | 124,621 | 495 | 500 | 486 | 490 | 5 | 4 |
| Bachelor's Degree | 515,215 | 517,495 | 536 | 542 | 528 | 531 | 6 | 3 |
| Graduate Degree | 387,232 | 391,109 | 566 | 575 | 557 | 562 | 9 | 5 |
| Custom Demographic | 42,151 | 46,582 | 602 | 616 | 640 | 640 | 14 | 0 |
National Hispanic Recognition Program
Some of the most important data points we see prior to the Commended level leaking out are scores from the National Hispanic Recognition Program. While these cutoffs are lower than those for National Merit, the multiple regions can help fit a line upward. Unfortunately, I’ve only received news about the South and Southwest regions to date (Virginia/Florida and Texas). Another problem is that NHRP switched from Selection Index to total score this year for determining cutoffs. This means that we need to make the — sometimes risky — assumption that total score and SI fall in line. The Southwest cutoff for the class of 2017 was 191; for the class of 2018 the cutoff is 1280. If we assume an even split of EBRW and Math scores, the 1280 would convert to an SI of 192 — an increase, but a very modest one. For the South, the cutoff moved from 204 to 1360. Making the even split assumption gives the exact same cutoff as last year. Finally a small bit of evidence that NMSF cutoffs may not have gone up!
The NHRP figures are intriguing because Hispanic/Latino results went up just as they did for other segments. In the class of 2017, 25,441 students scored between 1200 and 1390, and another 2,829 scored between 1400 and 1520 (NHRP recognizes about 5,000 students, but the cutoffs are regional). The figures for the class of 2018 are 27,831 and 3,363. This can be interpreted in a couple of ways. We might argue that the South is an outlier and that most regions had higher cutoffs this year. Alternatively, we could say that — despite an increase in students falling into the top ranges — cutoffs were little changed (i.e. the change was large enough to move the cutoffs). The title of this post tips my hand as to which hypothesis I find more likely.
Using Percentiles to Estimate Increases
A mistaken pathway for NMSF predictions is the use of the percentiles presented in Understanding Scores 2016 versus those presented in Understanding Scores 2015 to gauge how scores have moved. College Board lags percentile reporting by a year, so the reported figures only tell us what happened with the October 2015 test. The percentiles in the earlier version of Understanding are based on a pilot study. It’s possible, though, to get an inkling of what the additional 9,288 students in the 1400-1520 range on the October 2016 PSAT/NMSQT might mean. That’s just over 1/2 of 1% of test-takers. On the total score percentile scale, we need to move about 10 points (a bit more if we allowed for interpolation) at the relevant part of the scale. In other words, we know that 55,587 students got 1400 or above on the October 2015 test. Accounting for 64,875 students on that year’s test would require us to move down at least to 1390. Filling in the gaps with yet more assumptions, I would argue that the extra 9,288 students is evidence (not proof!) of a 1-2 point shift in the Commended level.
Why are PSAT Scores Rising?
Many have speculated about reasons why scores might go up this year. Common theories include more practice materials, improved preparation, and test familiarity based on the sophomore year PSAT. While any or all of these may have had an impact, I subscribe to one that has historical precedent — College Board doesn’t always get the scaling right. When you are talking about the top 1-3% of test-takers (depending on the state), even the smallest hiccup on a problem or two can impact scores. In theory, the scale can take problem difficulty (or the invalidation of problems as happened this year) into account. In practice, small deviations occur.
I give added weight to the “scaling theory” because the October 2015 PSAT was scaled before the final SAT scale was set in stone. College Board may have made adjustments for the October 2016 test. That would help explain why segments at all ability levels and across essentially all demographics saw score increases.
Comparing New PSAT Cutoff Changes to Old
Readers familiar with my posts on historical scores will recall my horror at what happened on the 2011 and 2012 PSATs (classes of 2013 and 2014). The Commended cutoff went from 200 to 203, and 49 of 50 states saw increased NMSF cutoffs. One might argue that this was due to some permanent shift in testing behavior except that scores settled back down again in 2013. In other words, College Board got it wrong. In half of the years from 2007 to 2014, the Commended cutoff was 201, but it was also at 200, 202 (twice), and 203 over that period. Preparation effects would have done nothing to explain those bounces.
It’s interesting — in a grad test seminar sort of way — to look at historical score distributions and Commended scores to get a sense of what level of swing in one is correlated with a given level of swing in the other.
Historical PSAT Score Range Distribution
| Subject | Range | Class of 2011 | Class of 2012 | Class of 2013 | Class of 2014 | Class of 2015 | Class of 2016 |
|---|---|---|---|---|---|---|---|
| Critical Reading | 75-80 | 0.8 | 0.9 | 0.7 | 1.1 | 0.9 | 0.8 |
| Critical Reading | 70-75 | 2.1 | 1.7 | 1.8 | 2.8 | 1.6 | 2.5 |
| Critical Reading | 65-69 | 3.9 | 3.9 | 3.9 | 3.1 | 3.6 | 3.1 |
| Math | 75-80 | 1.6 | 1.5 | 1.0 | 1.3 | 1.8 | 1.7 |
| Math | 70-75 | 2.2 | 2.2 | 2.8 | 2.1 | 2.6 | 2.5 |
| Math | 65-69 | 4.7 | 5.9 | 6.1 | 5.7 | 5.2 | 6.3 |
| Writing | 75-80 | 0.7 | 1.1 | 0.9 | 1.2 | 0.7 | 0.9 |
| Writing | 70-75 | 1.7 | 1.2 | 1.0 | 2.0 | 2.1 | 1.9 |
| Writing | 65-69 | 3.3 | 3.2 | 2.8 | 3.3 | 3.6 | 3.7 |
| Commended Student | 201 | 202 | 200 | 203 | 201 | 202 |
Unfortunately, direct comparisons between old and new PSATs are difficult to make because of the significant compression in the scale at the top end (the Selection Index now tops out at 228 and the lowest class of 2017 Commended cutoff fell at 209). Scores on the old SAT were also more lopsided than they are now, with far more high Math scores than high Critical Reading or Writing scores. Additionally, the historical College Board reports do not give figures for total scores or Selection Indexes; we must look at each section in isolation. We can see, though, how certain shifts caused the biggest swings. In the “low” year for the class of 2013, Writing stands out as having an abnormally low percentage of students in the 65-80 range. In the “high” year following, Writing bounces back and 70-80 scores for Critical Reading jump a rather absurd amount (2.5% of students to 3.9%). Doing far more math with the old PSAT scores than I will present here, it does seem as if the distributions figures we are seeing this year could explain a 1-2 point SI increase.
Expectations for Cutoffs
It’s still possible that the score range movements on the October 2016 PSAT are not enough to shift cutoffs upward. The evidence, though, points to an increase. I think it’s virtually impossible that the average NMSF cutoff level will go down. The more likely result, in my opinion, is that the Commended level will move to 210 or 211. I do not think that 209 is out of the question, although I think it about as unlikely as a 3-point increase to 212. We should have an unofficial confirmation of the Commended level by the end of April. As always, I will be updating our National Merit posts or comments as we receive more information.
Related Posts
National Merit Semifinalist Cutoffs for the Class of 2018 is the hub for the most current Compass information.
PSAT National Merit FAQ provides specifics on the various points along the way from PSAT/NMSQT to National Merit Finalist or Scholar.
Historical National Merit Cutoffs provides old PSAT cutoffs unadjusted and adjusted — to the extent possible — to the new PSAT scale.
Postscript
I feel that I should address a blog post by another company that has been mentioned by several readers. The post “predicts” significant decreases in National Merit cutoffs. The post is so flawed that — if you are unaware of it — I strongly encourage you to stay that way. This footnote is for those who may already have been infected.
A Flawed Post on NMSF Cutoffs
In January, a site I’ll refer to only as PE posted their “predictions” for the class of 2018 NMSF cutoffs. They have received a good deal of attention because of the large decreases predicted. Google does many things well, but it can’t sift good information from bad when it comes to NMSF levels. I’ve received several questions about these “too good to be true” numbers. I’ve been coy about addressing the post directly because I am hesitant to shine attention on something clearly designed to garner attention rather than to add value (ah, the Catch 22 of the internet). If nothing else, this footnote provides me with an easy reference point when I am asked about the topic.
One of the points I try to make regularly is that one doesn’t need to make up predictions because the best estimates — barring clear, new inputs — are the prior year’s scores. Deviation from those knowns should be supported by evidence [as I’ve provided above and in other posts] and come with the caveat that — outside of a few insiders, perhaps — no one knows in springtime exactly where the cutoffs will fall. Much of what I and many others try to do is bring context or information. The sure sign of a useless set of predictions is one that does nothing to explain how the figures were derived.
It feels silly to seriously discuss predictions that are so obviously nonsensical, but I can’t let them go unchallenged; I consider the misinformation harmful. The lowest states are pegged at 204, which implies a Commended level there, as well. That is a 5-point decline from the class of 2017 figure. Such a large decline has never happened. Many things happen that have never happened before. But if you are going to call for a 100-year flood, you should have evidence to back it up. Is snow pack at an all-time high? Are rivers filled with silt? Why, in a year where the average PSAT score went up and when a higher percentage of students scored in the 1400+ range, would you call for a record decline in cutoffs? It’s incomprehensible, it is not going to happen, and the predictions get even sillier.
Let’s examine the fate of Alaska, Arkansas, and New Mexico cutoffs according to the PE post. All of those states had the same 213 cutoff in 2017. Arkansas’ cutoff is supposedly going to fall to 208. Alaska’s is going to fall to 211. New Mexico’s is to GO UP to 215. There is absolutely no reason to think that Arkansas and New Mexico will differ by 7 points. It’s never been true in the past and it won’t be true for the class of 2018. In another example, the post is giving false hope to students in Kansas and Minnesota when it predicts cutoffs to fall 7 points in those states. The various figures may give some indication of what has gone wrong. The PE author seems to be taking some sort of weighting of scores by combining earlier cutoffs with those of the class of 2017. He does this, however, without any regard to the fact that the test has changed! I know better than to average the cost of bread in 2017 with the unadjusted cost from 1970 to give the cost of bread in 2018.
According to PE, the top states or selection units will be MA (223), CA (222), MD (222), DC (221), VA (220), NJ (220). Could the top cutoff rise to 223? It’s possible (much more likely than the Commended level going to 204). It’s possible that Massachusetts’ cutoff will be 223. What is not possible is that not only do NJ and DC drop from the top spots, they fall behind 3 other states. That will not happen. You heard it here first.
One of the more objectionable traits of the post is including PSAT total scores as if they were comparable to Selection Indexes when discussing state cutoffs. Anyone who has read through our comments section knows how confusing and disappointing it can be when one student qualifies with a 1450 and another misses out with a 1450. Selection Index is the ONLY score used to determine National Merit. The SI is on student score reports and is easily calculated. Providing total scores without an explanation is irresponsible. [I have tried to be extremely clear in my post above as to when and why I have used total scores and how they can be misleading. NMSF or Commended cutoffs should never be stated as total scores.]
In sum, there is no truth to the predictions/guesses in the PE post except, perhaps, in a stopped clock manner.
I understand students’ and parents’ desire to have answers now rather than in August or September, but the National Merit timeline means anxious waiting for most families. I may be proved wrong in my expectation of higher scores (I’d like to be proved wrong), but I will tell parents and students how I come to conclusions and why things are often inconclusive. I trust in researchers not oracles.
Art, great information as always. You mention the citizenship requirement, and I do wonder how big a factor that is given what is reported as a surge in the number of foreign high school students studying in the US. These students need to perform well on SSAT and other exams, and usually have certain socio-economic status to qualify to study here – hence high standardized test scores generally. But, this non-citizen factor skewing materially (1) the score range changes in your first chart above (up 16.7 % in the highest range) from (2) the cut-offs, would require a material year-over-year increase in foreign students taking and scoring highly on the test I think?
Any thoughts on whether and how this factors in?
Thanks!
Mark,
It’s an interesting take and might be a long-term trend. I don’t think the volume of such students — or the change in a single year — would be enough to register that large of an effect. I looked at a lot of demographic groups (most of which didn’t make it into the post), and the increases were there almost universally. Because of NMSC’s timeline in how it reports data for a class, we probably won’t know the actual test-takers versus program participants numbers for 2-3 years. Which makes for plenty of time to speculate. Just so others follow along… if the increase in top scorers was from an influx of NMSP-ineligible students, then the cutoffs would not be impacted. If the increase in top scorers represents primarily eligible students, then it is far more likely that cutoffs would increase.
I suspect — whether you go with a scaling theory or a prep theory or something similar — that we are seeing shifts in scores rather than shifts in test-takers. We’re up 9,000 students at the top end because they were “borrowed” from the range below (1400 is the new 1390). The 1200-1390 range is up 21,000 students because, despite the loss of 9,000 students to the higher range, it picked up 30,000 students from the even meatier 1000-1190 range. And so on. This would also explain why the range with the largest percentage decrease is the lowest score range (it was “donating” students to the higher range without replacement). This model by no mean fits perfectly, but I’m always attracted to endogenous explanations, I suppose.
Art, based on the current available information, what would be your educated guess for highest NMSF cut-off state score for 2018, 223, 224 or 225?
Parent,
I continue to believe that the hard-cap of 228 means that each bump becomes far less likely at the upper reaches. My educated guess would be that the highest cutoff or cutoffs will move to 223 or 224 this year. Because a 2 point increase has more to prove — and because I prefer being an optimist — I’m going to say that I think 223 is the more likely figure.
Hi Art,
Great information as always! Dare I ask your prediction on the upper level SI? Still nervous in PA with a 221. Thanks!
Grateful,
Since we can’t draw conclusions from a single year of new PSAT scores, I’ve been thinking about ways that I might use the historical figures to better reflect how aligned Commended movements are with state movements. I’d still be very confident with a 221 in PA. Hopefully we’ll find out more in the next few weeks.
Rough percentage estimates of a 217, 220, and 222 advancing to the NMSF stage in PA this year? Also, what might the earliest date that 2018 cutoffs will be available on the Internet (I assume the figures will be online before my high school notifies me and before the College Board mails letters). Thank you for your time.
Matt,
My own affinity for numbers has probably drawn me in more than it should have in terms of putting probabilities on things — there is simply so much that we don’t know. The information I use is based on two set of facts — 1) there is upward pressure on scores — at least near the Commended level this year and 2) what has happened historically. Generally movements in high-scoring states has been more muted than changes in the Commended level. With the Commended level increasing two points this year, I think we’ll see a large number of states with 0, 1, and 2 point changes and some outliers with cutoffs that go down (or go up by more than 2 points). At 218, PA’s cutoff is certainly not as high as CA or NJ, but it is still unlikely to see a 3 point change. I think the most likely change is to 219, although I would not be surprised to see it stay at 218. A 220 cutoff would fall close behind. I doubt that we’ll see a 217 or 221, but they are not impossible. I don’t see any chance that the cutoff could move to 222. I’ll let you assign your own probabilities, but I’d like my odds at 220 (fully admitting that I’d be anxious until cutoffs become known).
We sure appreciate all of your work on this. Any ideas about how much specific states may jump up? Wondering about Colorado. Is there a chance for it to jump 4 points? Thanks!
Anxious,
We’ll know a lot more once the Commended level is uncovered. A 4 point jump in CO would be extremely unlikely.
Art, I appreciate all this information. You are so thorough in your analysis.
Would a 223 make NMSF cutoff in TX? Thank you so much for all you work.
Heather,
Yes, I think it will. I don’t believe that the highest cutoffs can go above 224, and it is highly unlikely that Texas would join that top group this year (the state does seem to be on an upward swing, but it will still be at least 1-2 points behind the highest cutoffs, in my opinion).
Art,
I’m wondering if you still think a 223 in CA is likely?
I still think it is likely to hold. If Commended comes in at 210 or lower, I think it’s very safe. If it goes to 211, a 223 is starting to be a bit more vulnerable. It gets far dicier if the Commended level went as high as 212. The “whacky period” of Class of 2013-2014 when Commended went up 3 points is interesting. All of the top states went up at least 3 points. Maryland and Virginia actually went of 4 and 5 points, respectively. Keep in mind that I am talking about unadjusted old PSAT scores there. We would expect a 3 point move on the old scale to be more common than a 3 point change on the new, compressed scale.
Do you think that it is likely PSAT semifinalist cutoffs will move up 221 in Arizona (+3 points)?
Dan,
I think it unlikely, but we will know more once the Commended level comes in.
Art, thank you for your thorough analysis. My daughter took both the 2015 and 2016 tests so I have the answer sheets. As I was looking at them, I noticed there was a big difference in the difficulty level of questions between these two tests. In 2016, there were more “easy” level questions in all 3 sections ( R:5more, W:6more and M:3more) than in 2015. For “medium” level questions, again there were more easier questions in EBWR than in 2015 (R:6more, W:17more, M:-3less). If you combine the easy and medium level questions, the 2016 test was definitely “easier” in EBWR (by R:11 questions, W:20questions, M:0) which will lead to higher scores in EBWR as reflected in your analysis above. The other way of looking at it is: in 2016, there were fewer “hard” questions in EBWR (total hard questions R:9, W:14, M:20) compared to 2015 (R:20, W:31, M:20). Based on this data, you will definitely see higher averages in EBWR as there were more “easier” questions. I am curious who your “custom demographic” is as it appears to better reflect the difficulty level of the 2016 test.
S.,
Thank your the detailed analysis.
It’s tricky to draw conclusions about difficulty from the labels, as they are simply broad categories to make things easier for the layperson to understand. For example, a question answered correctly by 69% of students might be a Medium, whereas one answered correctly by 71% of students would be labeled Easy. We can’t even guarantee that College Board used the same naming rules in 2015 and 2016. Second, “difficulty” is a tough thing to pin down. The examples you cite have to do with the raw test difficulty — how many students get questions right. But students don’t receive a score based solely on how many questions they answer correctly. On the 5 different forms given over the last 2 years (2 in 2015 and 3 in 2016), a student getting 40 questions right in Writing could have received a score as low as 34 or as high as 36. The scaled scores are designed to adjust for differences in raw difficulty. The test where 40 points equaled a 34 had easier questions than the form where 40 points equaled 36. So on which test was it easier to score a 36? In theory, it should have been the same in either case.
Thanks for your analysis. You answered many of the questions I’ve been wondering about but hadn’t found data for. I’m interested in this, but not just because it looks like my daughter may have missed it by 1-2 points (219 in Texas). Wen I did some final studying with my son two years ago, I became aware of how much his score could vary just based on the test and how much your score could now change in the upper ranges, depending on the scaling of the test you took. (I was a National Merit Scholar is 1987.)
While some students always are going to get a perfect score every time, I think there are more and more that it is going to be a hit or miss issue for – much like winning an Olympic Gold. That’s why I think compression of the scale on the upper end is troubling.
In addition, the College Board has other issues. On my daughter’s 219 – she had one perfect section, missed 1 each in two sections, and missed 5 in the fourth math/no calculator section, more than she usually misses. The reason I think that is significant is that section had only 17 questions, and 2 were thrown out as unscorable, which to me as a past science ancillary material writer indicates a very poorly written section. That shouldn’t have happened on a test at this level. In addition, the College Board originally intended that section to have 20 questions, but found students couldn’t complete that section, and they dropped the number. So my daughter got caught on a section with severe design issues.
That, in addition to my son being in the group of students in June 2015 that had half their test scores thrown out, raises serious questions about colleges continuing to let the College Board control a large number scholarships.
E.S.,
NMSC regularly comes under criticism for using PSAT cutoffs to determine scholarship eligibility. A number of college over the last decade have backed away from offering National Merit Scholarships. On the other hand, the scholarships are welcome financial aid to many students and colleges such as the University of Oklahoma use the NMSP as a way to attract top students. You are absolutely correct that a test this important should be of higher quality than we have seen the last two years (technically, National Merit is administered by the independent NMSC, which does not have oversight of the PSAT). I recall seeing 1 problem being thrown out on average of every 5-10 years on the old PSAT. To see 3 questions in 2 years (and 2 on one section!) demonstrates the rush to introduce the new test.
While compression is a concern, the old PSAT scale certainly had its share of problems. It sounds like your son took the old PSAT, where changes in raw score at the top end of the range made for particularly large swings — the old test was simply not up to the task of accurately assigning scores across the entire 20-80 range. The old test had to make do with only 38 Math questions.
We have noticed that the no calculator section can be a real trap for students. The time required to solve harder questions can vary tremendously, and it is easy to get bogged down. It certainly did not help matters that the two questions were thrown out. At least the questions weren’t unsolvable in a way that would have ruined the pacing for students, but that’s faint praise. The PSAT family (PSAT/NMSQT, PSAT 10, PSAT 8/9) has become big business. I hope that College Board devotes sufficient resources to achieve the level of quality that students deserve.
Thanks for the extra insight! I agree that National Merit Scholarships are definitely important – a welcome boost for academic excellence – so I echo your hope that the College Board will bring up the quality.
Art,
My daughter, a freshman, took SAT on Oct 2016 and scored 1530/1600. Then on Jan 2017, mandated by her high school, she got 1400/1440 in the PSAT 8/9 . In 2019 , as a junior, she will take the PSAT NMSQT. Assuming her score gets her into the Illinois Semi-finalist, could her 2016 SAT score be submitted as final (though she will likely retake SAT again for 1600). Thanks.
Pete,
If I am doing my math correctly, your daughter is still a freshman. Unfortunately, NMSC only accepts fall sophomores through fall senior year scores as confirming scores. The score differential between the SAT and PSAT 8/9 is telling. It goes right to the heart of the criticism that the vertical scaling across tests breaks down in measuring the upper end of the range. The 1530 as a freshman is amazing, but like most students, your daughter missed a few problems. The same is true on the PSAT 8/9 — it’s just so easy to make a careless error along the way. On one test she ends up with a 1530, on the other a 1400. That’s not what I would consider useful vertical scaling.
I’d recommend a retest (no rush). Some colleges prefer that scores are from a more recent test.
Art,
I appreciate your reply. Indeed my high school freshman daughter took the new SAT on Oct 2016 as it was a selection requirement for admission at IMSA, a 3 year STEM public high school here in Illinois. Selection date is May 1st. Sigh!
For your vertical scaling analysis, here is her score breakdown:
SAT PSAT 8/9
math: 780 720
r/w: 750 680
Total: 1530/1600 1400/1440
%. 96%. 97%
In this case, the PSAT 8/9 seems predictive on her SAT score, especially showing likely weakness in reading. As you said, eliminating careless error will require Herculean effort from her to snare 1600.
By the way, this year Illinois has replaced ACT with SAT as standard testing statewide at public high schools. Is this occurring to other states and if so, what are future impacts?
Again, thanks much for your time.
Thanks for the extra information, Pete.
Yes, more and more states have been choosing a dance partner. ACT has been the big winner, but College Board did recently lure away MI and IL. Getting more students into the PSAT pipeline will tend to raise statewide NMSF cutoffs for SAT states. The national impact is more muted, since there have been both wins and losses.
Art,
I scored a 219 in Minnesota. What do you think my NM chances are?
Nick,
You chances are probably close to a toss-up until we find out more about how scores are trending.
Thanks Art,
What do you think about my chances now that the commended score has been released?
Nick,
I have to admit that the 2 point change in Commended makes the 219 less secure. I expect most states to go up this year (I’ll often add the reminder that some will stay the same). One thing to consider is that MN had a new high (even restating old scores to new) last year, so maybe it was something of a fluke. If a “normal” year is MN at 217-218, then 219 would have a shot, even with an up year.
Mr. Sawyer, based on this info, what do you think the probability is of a 219 making NMSF in Ohio?
Jack,
The chance of a 3 point increase in Ohio is pretty low unless we see some extreme movement in the Commended level.
Hi Mr. Sawyer,
I know we won’t know much until the commended number is released, but could we see a 2 point increase in IL from a 219 to a 221? IL cutoff is already pretty high although not of the likes of CA and MA.
Anon,
Unfortunately, it is possible. Even in years with a consistent scale, state cutoffs do move around. Illinois has been shifting from the ACT to the SAT, so it’s possible that this would create upward pressure. You are right to think that the odds of this happening are a bit lower given the starting point. If scores shift overall, then it becomes far more likely that IL (or any other state) will show an increase.
Hi, if someone got a 220 in Texas, do you think there’s chance the cutoff will remain the same and they will become a semi finalist? Or according to the data, should the expectations already by way down to become one as it looks like the cutoff will move up? Also, when do commended scores come out? Thanks in advance!
Anonymous,
Sorry for letting your comment slip down my list. You can find my updated estimates on our National Merit Cutoffs page. The Commended level is at 211 this year, up 2 points. This means that TX may go up this year, but I still think there is a good chance that it will stay at 220.
I read on one of your other articles that the Commended level will be coming out in April. Do you have an idea of when we will be seeing that this month? Thank you!
Wisconsin,
We just received confirmation from two commenters on our primary NMSF post that they had spoken to NMSC and been told that the cutoff is 211. I’ll be updating pages accordingly — a brief note followed, in 1-3 days (?) by analysis on what this likely means for state SF cutoffs.
What are my chances in MS with a 211? Any chance the cut off will go down from last year?
John,
The Commended level — set nationally — is 211 this year, so some state cutoffs will also be at 211. Unfortunately, MS’s Semifinalist cutoff has been well above the Commended Student cutoff in recent years, so it probably will not fall. Congratulations on Commended Student honors.
Do you think 221 can be the cut- off for TX if the commanded cut- off is 211?
Thanks!
Sarah,
I definitely think it’s possible, especially since we don’t know exactly what drove the increase. It’s reasonable to assume that increases will level off at the very top of the scale — in other words, the top states are less likely than states in the middle cutoff zone to go up 2-3 points.
My school just informed me that I’m a NMSF, but is there any reason they would know this already? Do they have a list already or are they basing it from the commended cut off? They mentioned 211.
Jack,
Congratulations, but there was a mistranslation somewhere along the line. Schools only know the Commended level (211 Selection Index) at this point. No one will receive NMSF confirmation until late August.
Art, the cutoff in South Carolina last year was a 215. I am wondering what you think is the likelihood of an increase for this year, or if it might hold at 215 in our smaller state. Any predictions or hypotheses regarding the odds for a hold or increase here in South Carolina? Has SC traditionally been fairly stable on the score as a smaller state? Any idea where I might find a history of the score for SC?
John,
Most states will see increases this year. You can find historical scores (original and restated on the new scale here). South Carolina has been pretty typical in that the cutoffs have not always tracked the Commended cutoffs. The sample for any one state is too small for generalizations, so I’ve been working (under construction) on a model that looks at the probabilities across all states.
Do you think 218 will qualify for Florida? Would this be similar to your response to Sarah from Texas on April 7th.
Thanks!
Gary,
Florida’s cutoff is not quite as high as Texas’. I think that most states in the 211-219 range will see between 1 and 3 point increases (although there will be exceptions on both sides). That leaves 218 very much in play.
Wow. So, do you think there is a realistic chance that some states may go up more than 3 points?
Also, I noted that Florida was designated as a low volatility state. Does this mean you should expect a smaller movement of the score between 2017 and 2018?I noticed that some of the low volatility states had different upward bound increases. Some increased by only one and others by two. Does this help indicated which states will increase and by how munch?
Thanks again!
Gary,
I neglected to put your two comments together. Florida’s cutoff has been relatively steady, and it has not always moved with the Commended level. Since College Board stopped releasing state-by-state PSAT data 2 years ago, we can no longer look for “tells” in individual states. I’m working on a model to try to quantify how tied Commended and state cutoffs are, but that won’t necessarily tell us where FL will go.
Do you think there’s a good chance that a 218 in Mississippi will be high enough to make the NMSF cutoff?
Suzie,
A question that I can answer definitely today! Yes. Congratulations.
Thank you!!!!!!! Your reply made my day!
Hey, is there any chance a 220 can remain the cutoff in Texas? It doesn’t seem like it though so it looks like my hope should be lowered a lot. 🙁
Anonymous,
I wouldn’t give up hope. What I am finding from look closely at the historical numbers is that even when Commended levels change by 2 points, there is a 25% chance (or better) of a state’s cutoff remaining unchanged. Unfortunately, the chances would have been far better had we not seen an increase in the Commended cutoff, but there is not guarantee that Texas will go up. Good luck!
What are my chances in MO with a 217? Any chance the cut off will go down from last year?
Anchal,
When the Commended level increases 2 points, drops in state cutoffs are fairly rare (about 2-4 states out of 50).
What are my chances in Minnesota with a 219?
Ram,
My current estimate is that the MN cutoff will fall from 218 to 221. I have 220 as the “most likely,” but there is a chance that the cutoff will stay flat.
Art,
Yikes! A “most likely” MN reaching 220 would mean it rises to a level it hasn’t been on your translated scale of 2009 to 2017 scores. Holy cow.
And thank you for your wonderful work!
Dave
Thank you, Dave.
MN is a good example of why I’m leery of most likely’s. MN hit a new high last year. Do we expect that Class of 2017 was an exception, or do we expect that, like most states, MN will see some kind of increase this year? Without specifics on how MN students performed (thanks, College Board!), we just won’t know.